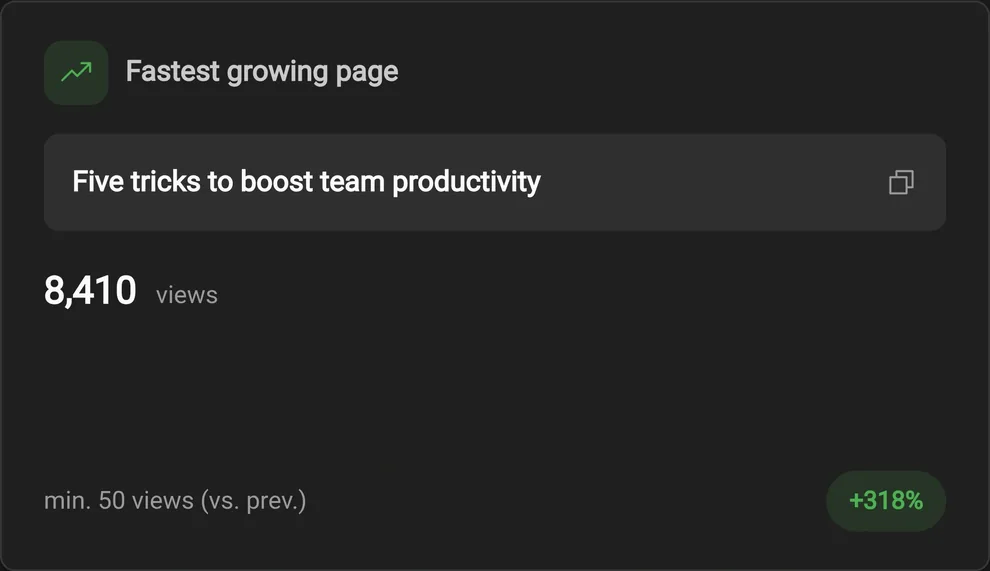
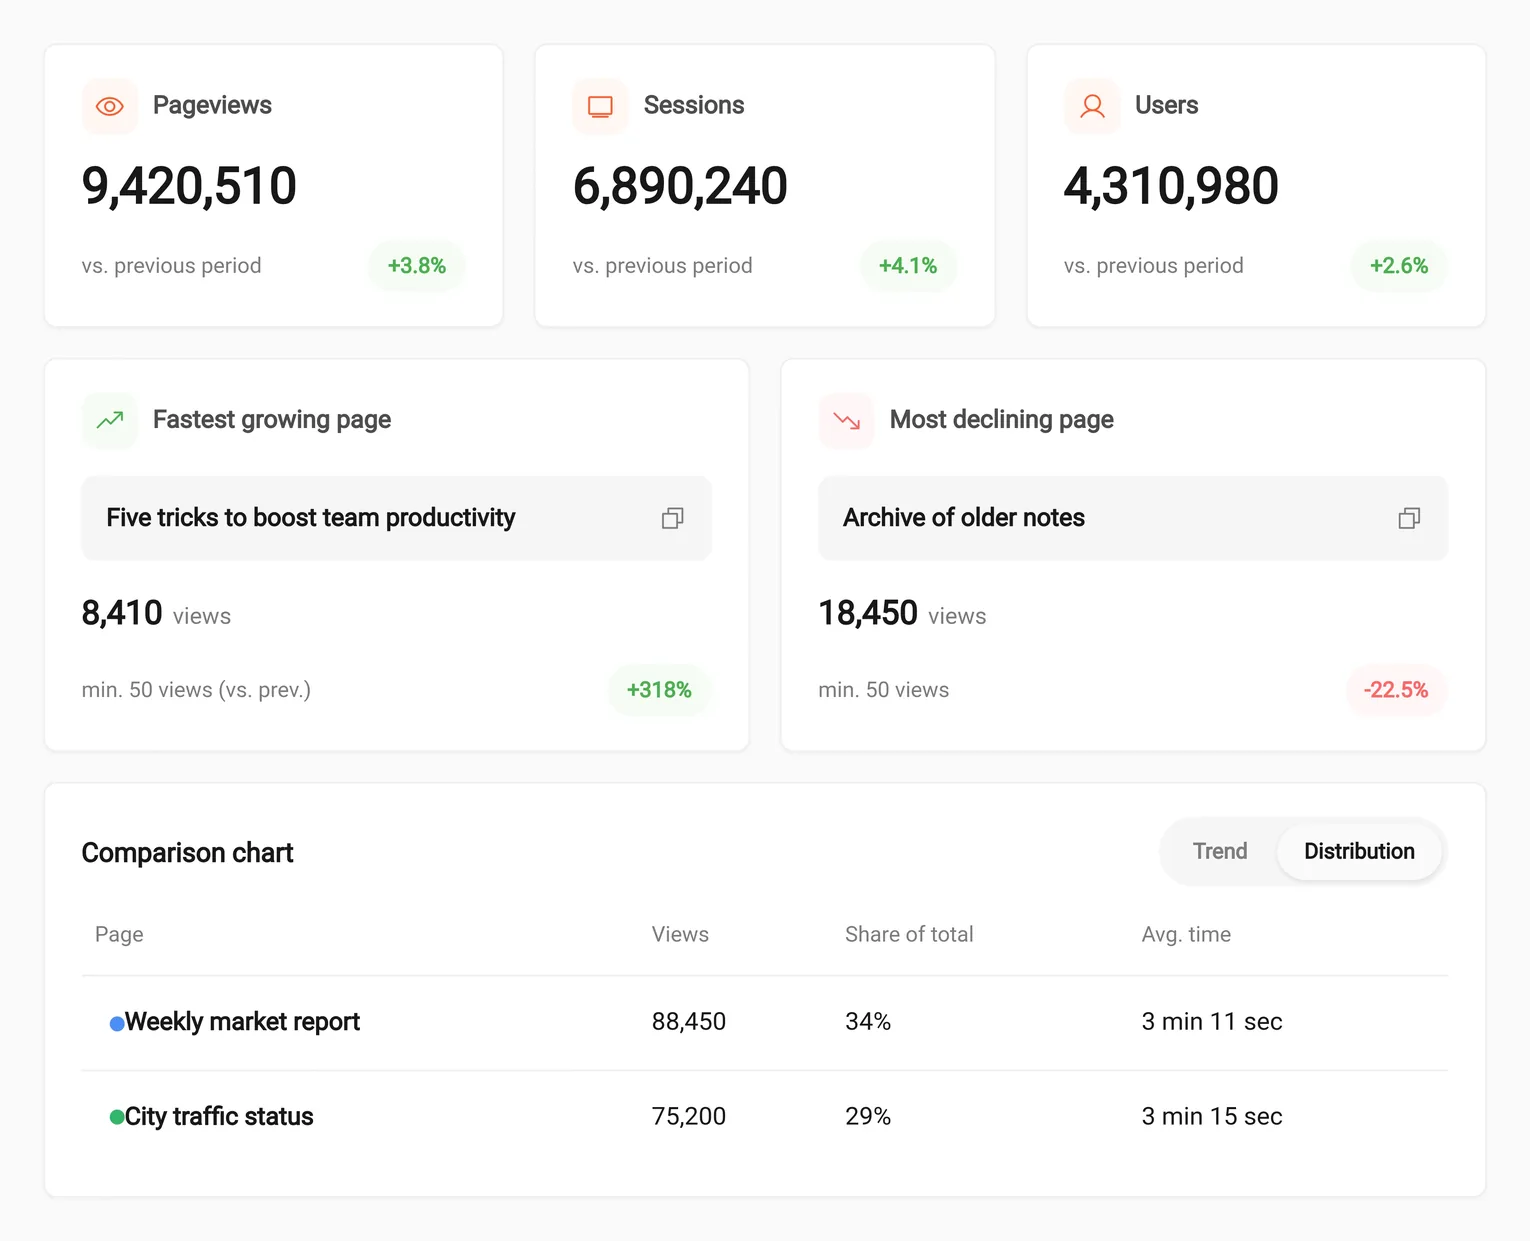
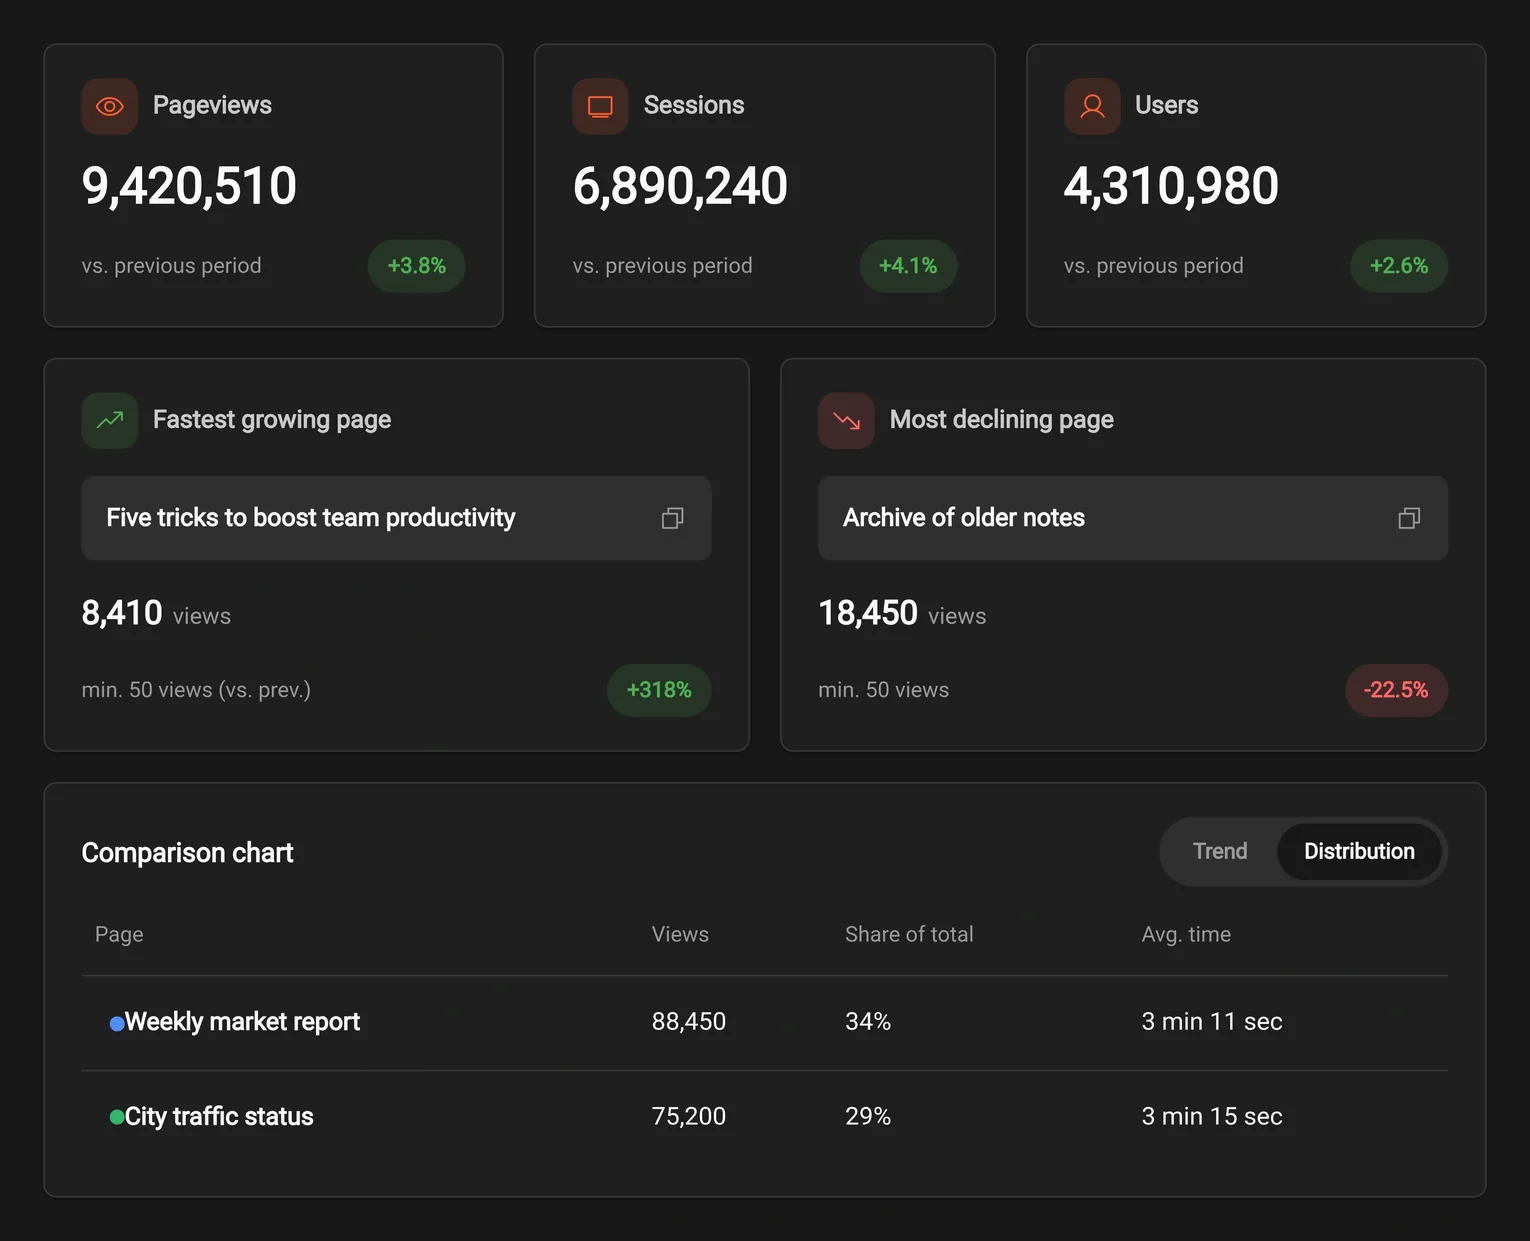
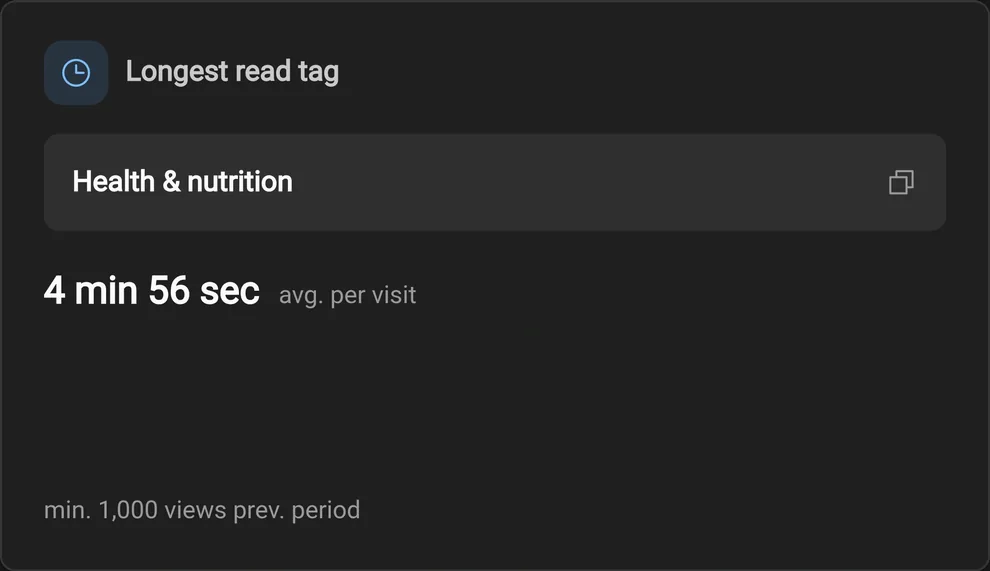
PAGES · ENGAGEMENT
See traffic and engagement part ways
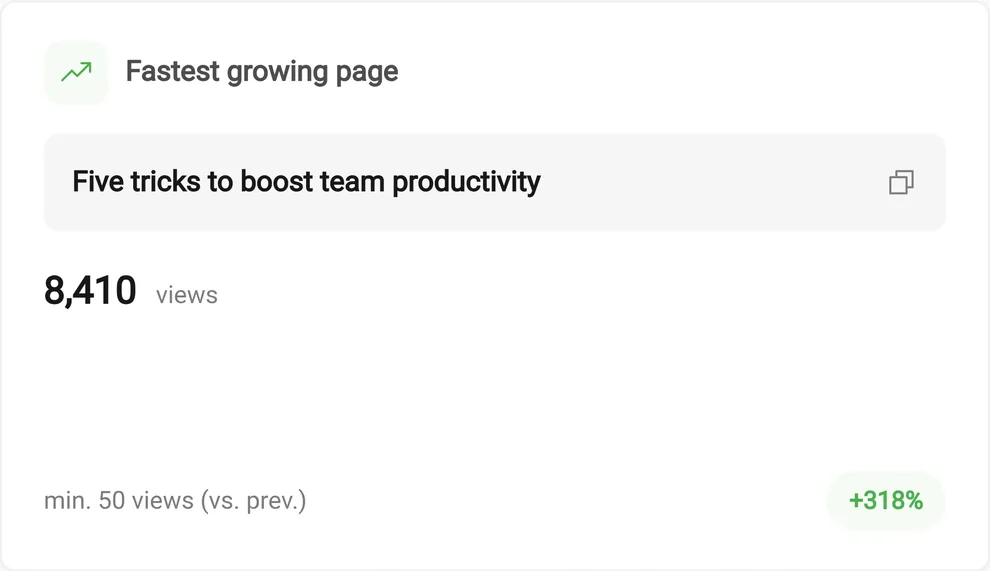
Shahin records every user session and interaction with precision, and instead of leaving you facing a mountain of raw data, delivers operational insights and ready-made reports — from live stats and top pages to journey analysis and session replay. This way you see users' real behavior clearly, while precisely measuring how much your content and product decisions actually accomplish.
From reacting fast to a traffic spike to studying trends and seasonal strategy — full coverage of audience behavior, with nothing lost along the way.
Watch traffic without delay, see how users engage as it happens, and manage consumption peaks.
Compare performance across different time ranges and track long-term trends.
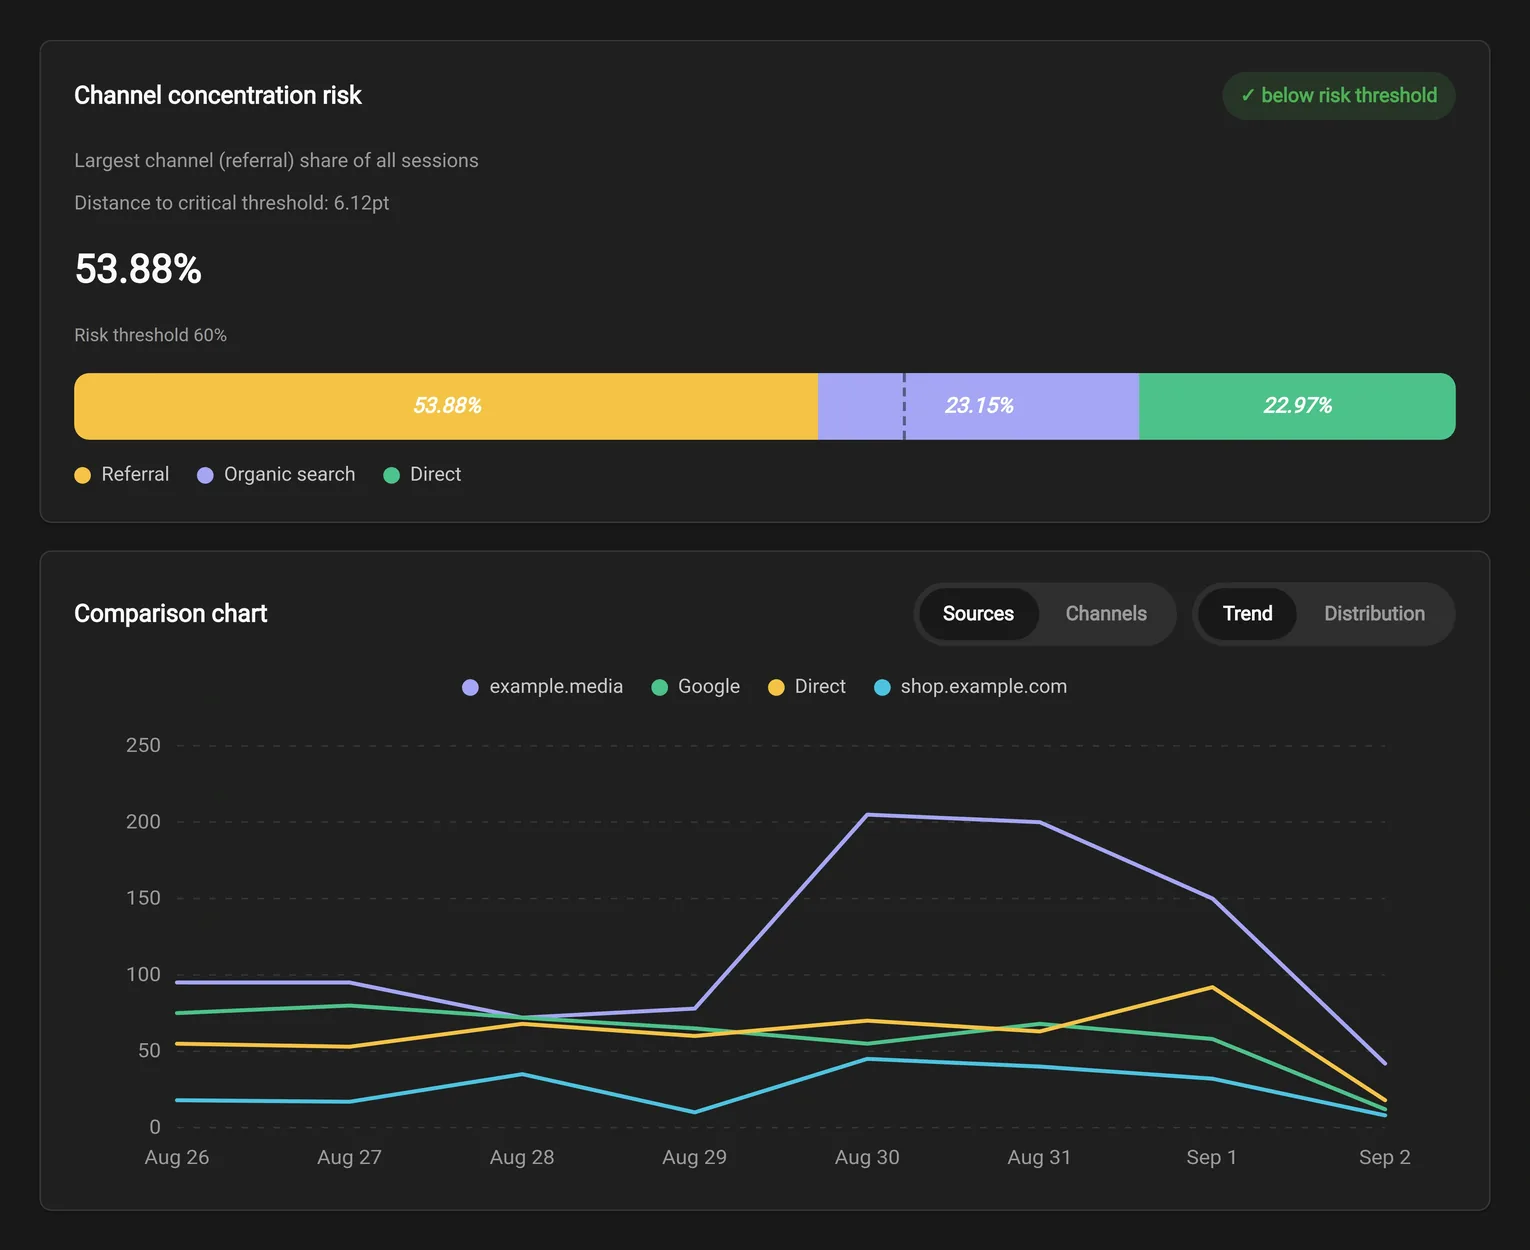
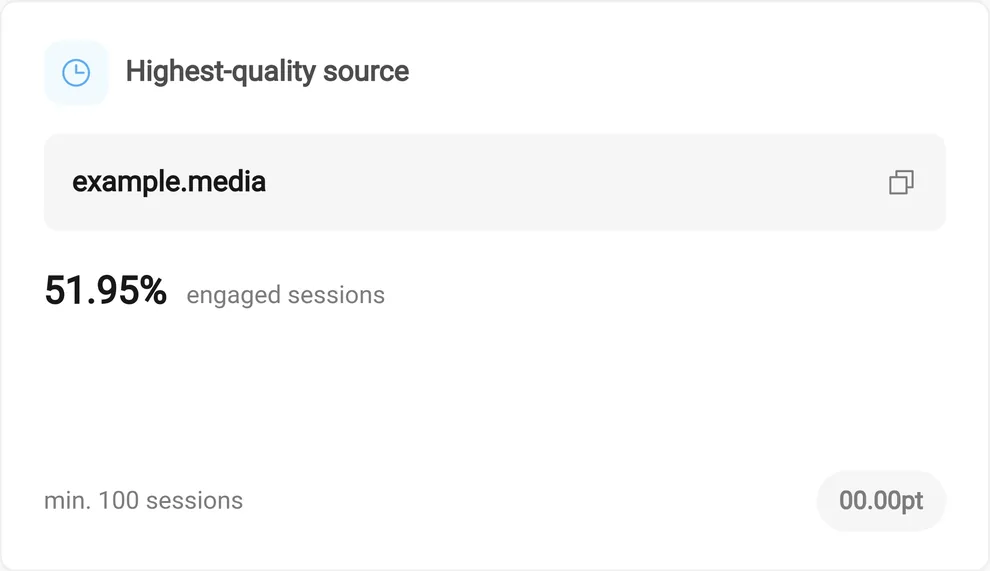
Which channels bring your audience in, and which entry paths hold the largest share of traffic growth?
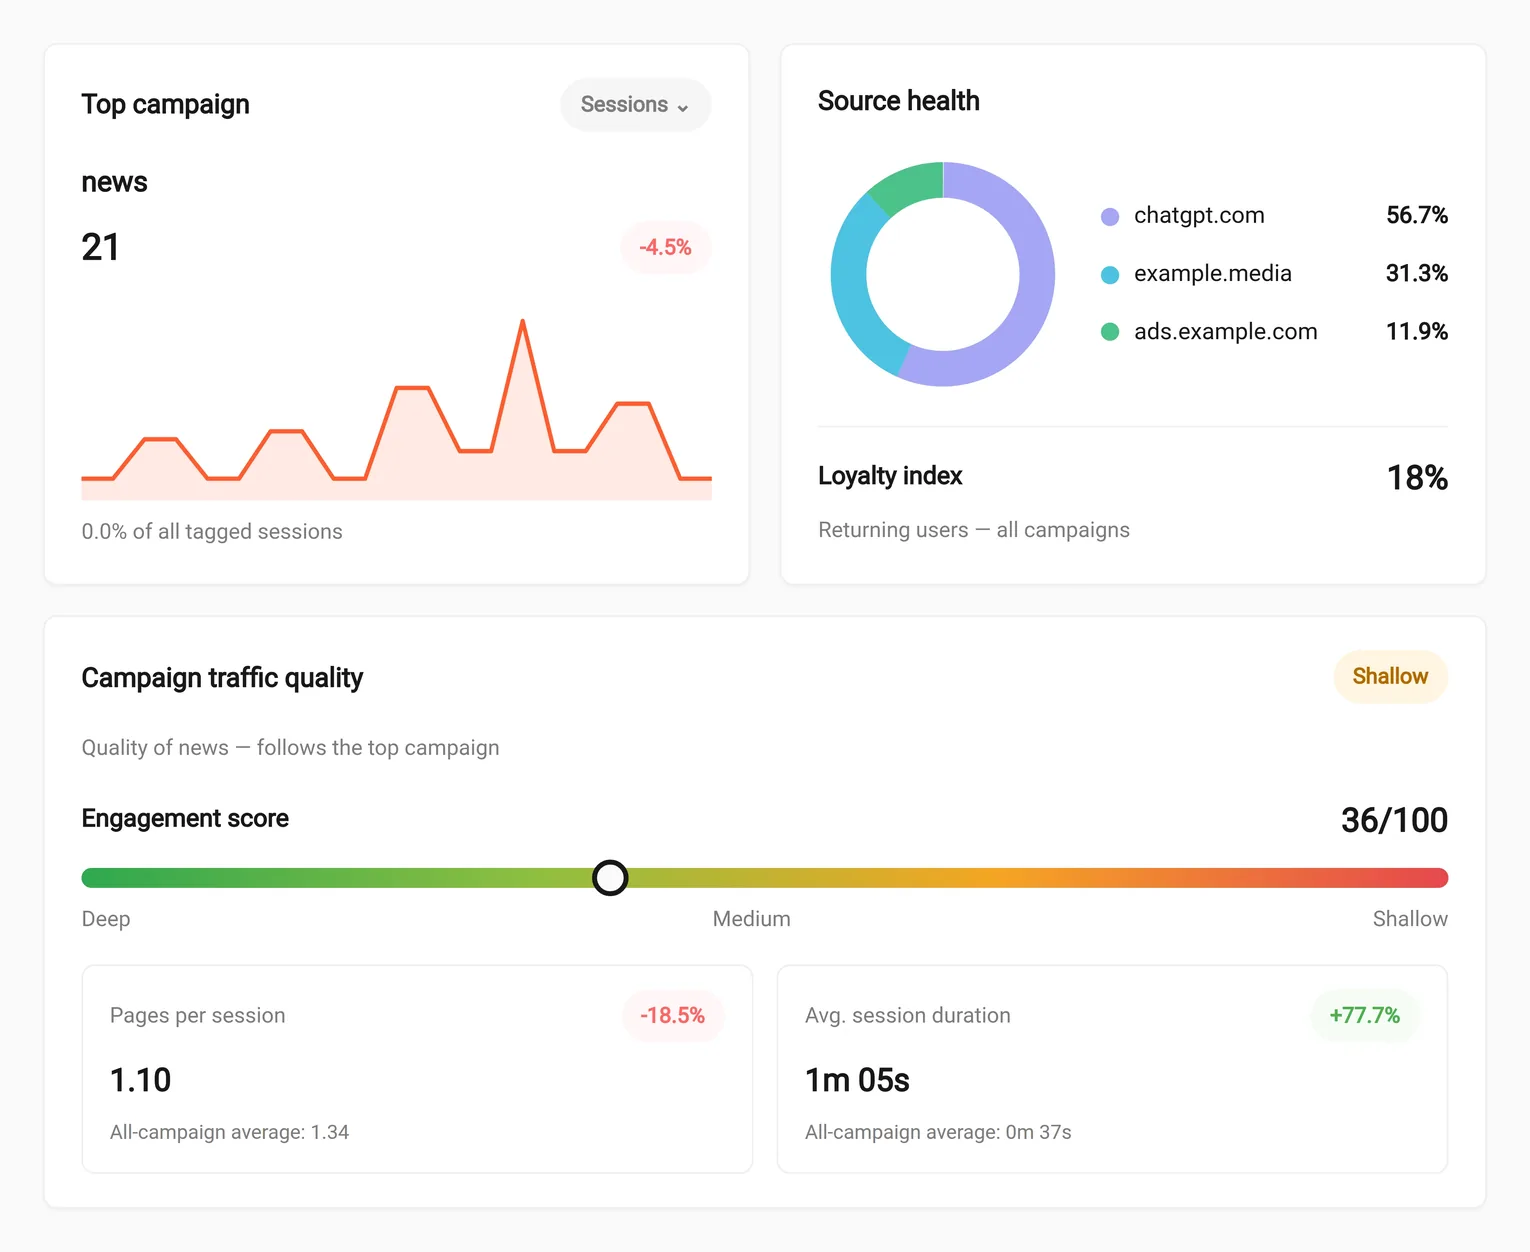
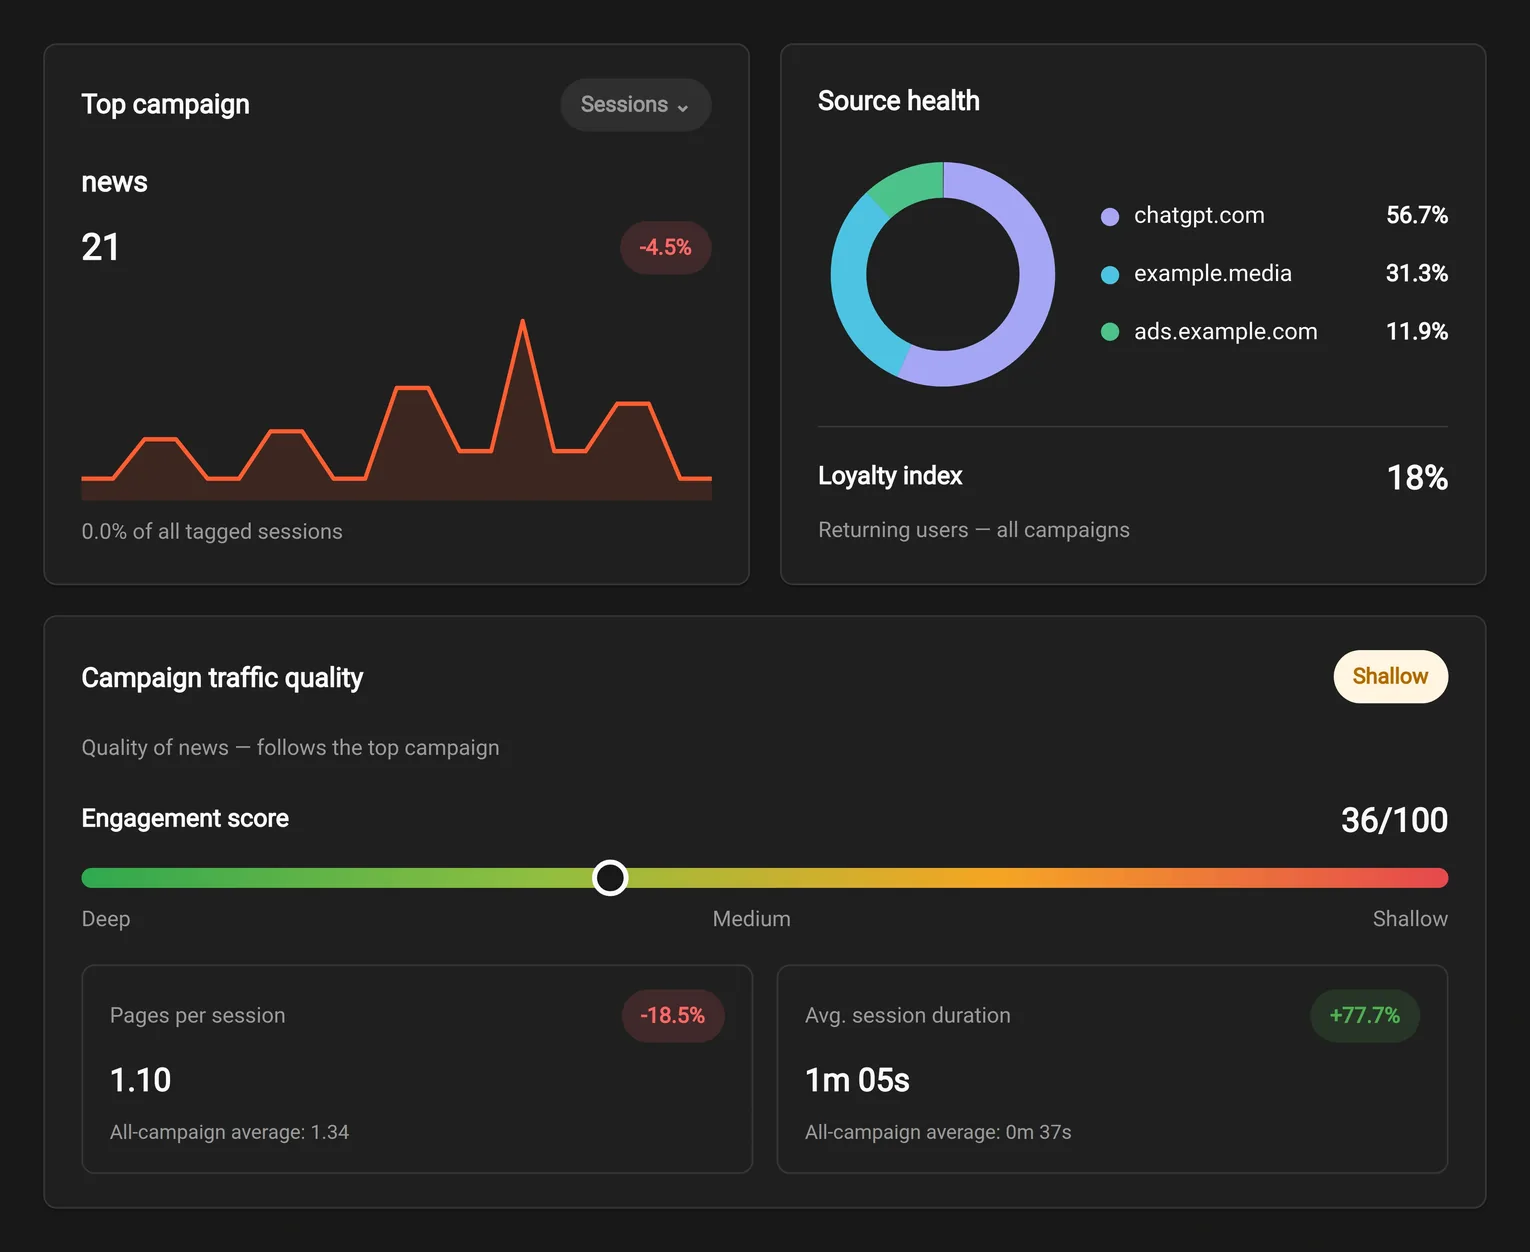
How deeply do users engage with your content, how long do they stay, and where does engagement peak?
What share of users come back to your platform, and which areas build the highest audience loyalty?
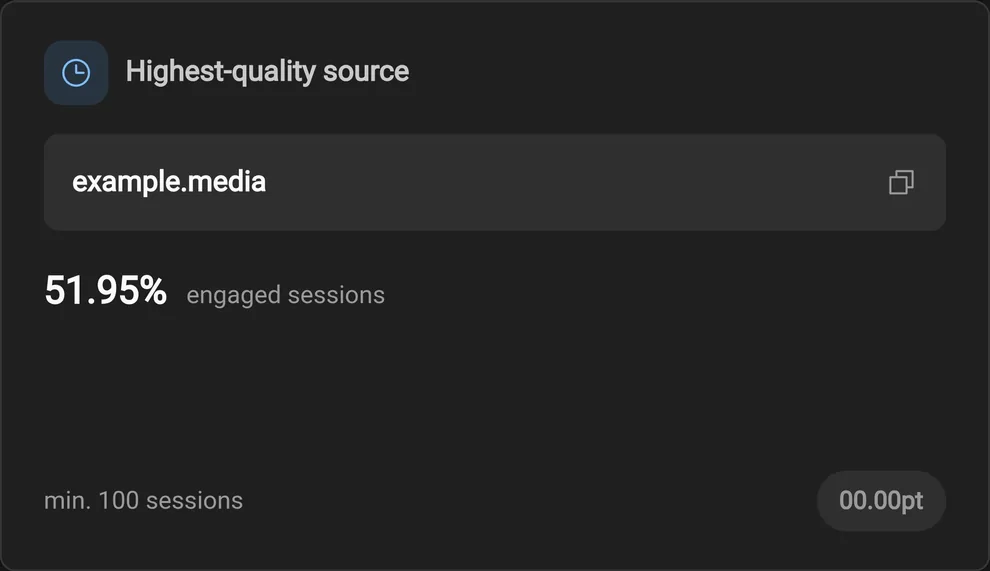
PAGES · ENGAGEMENT
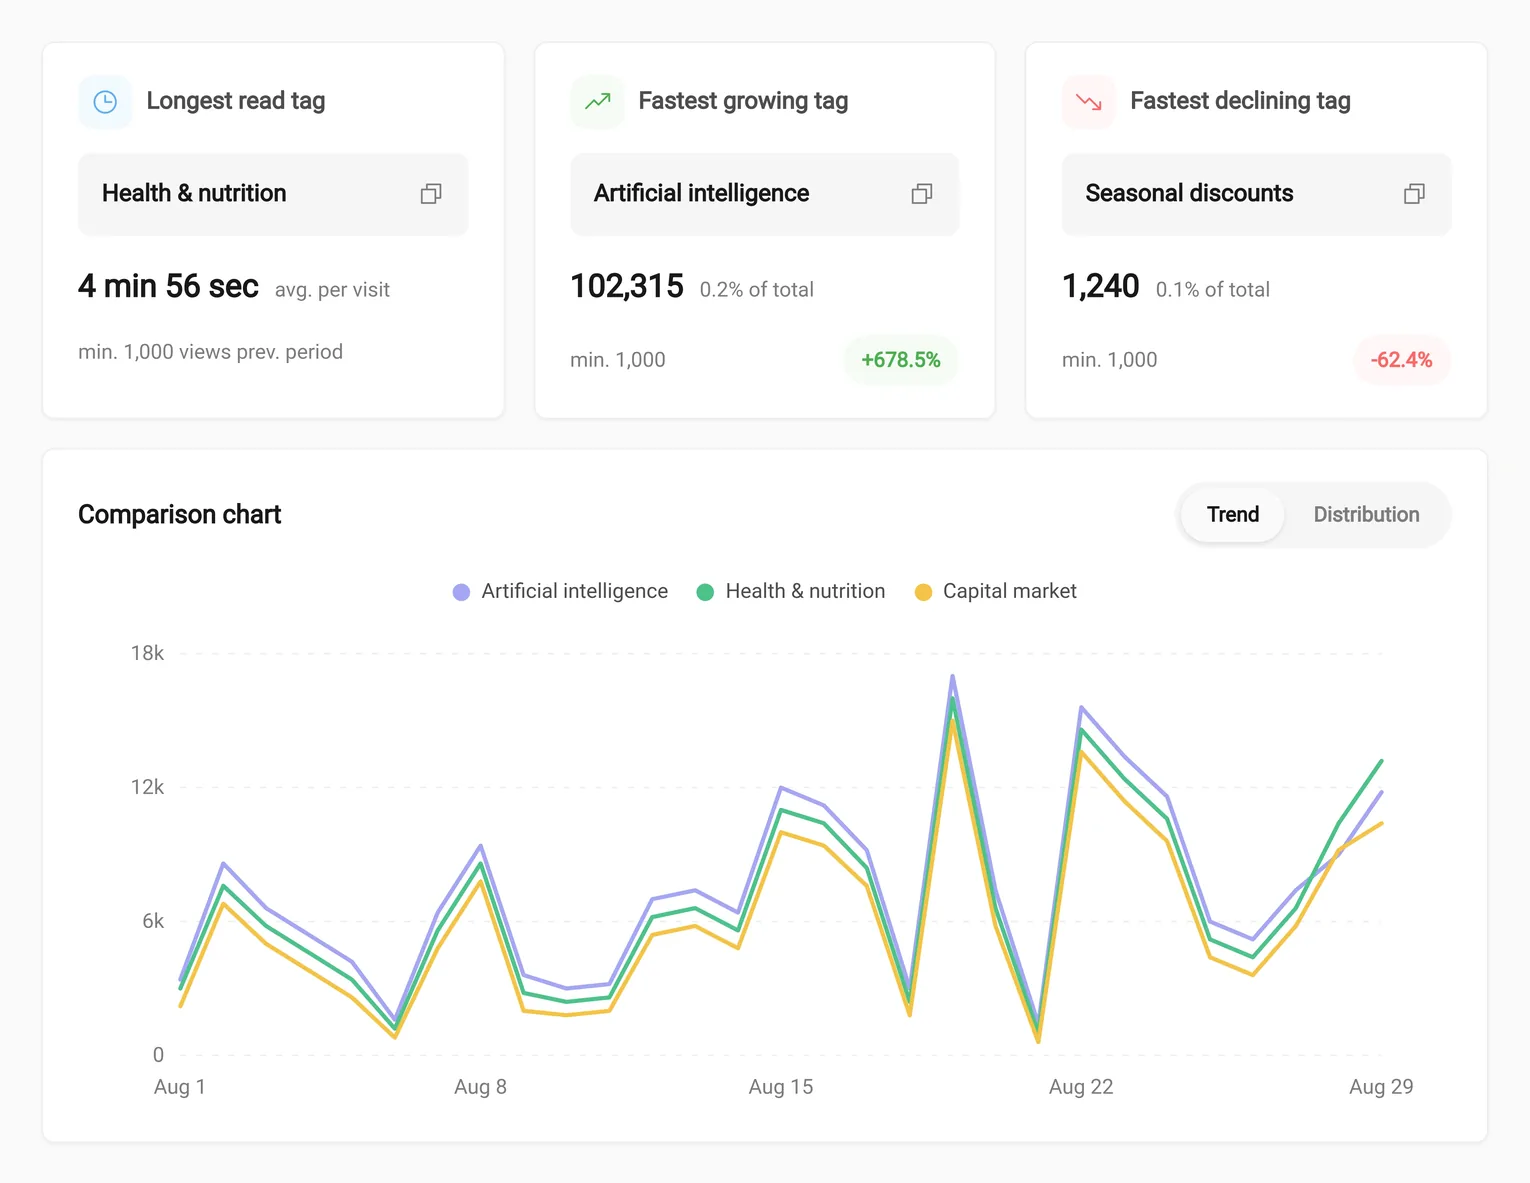
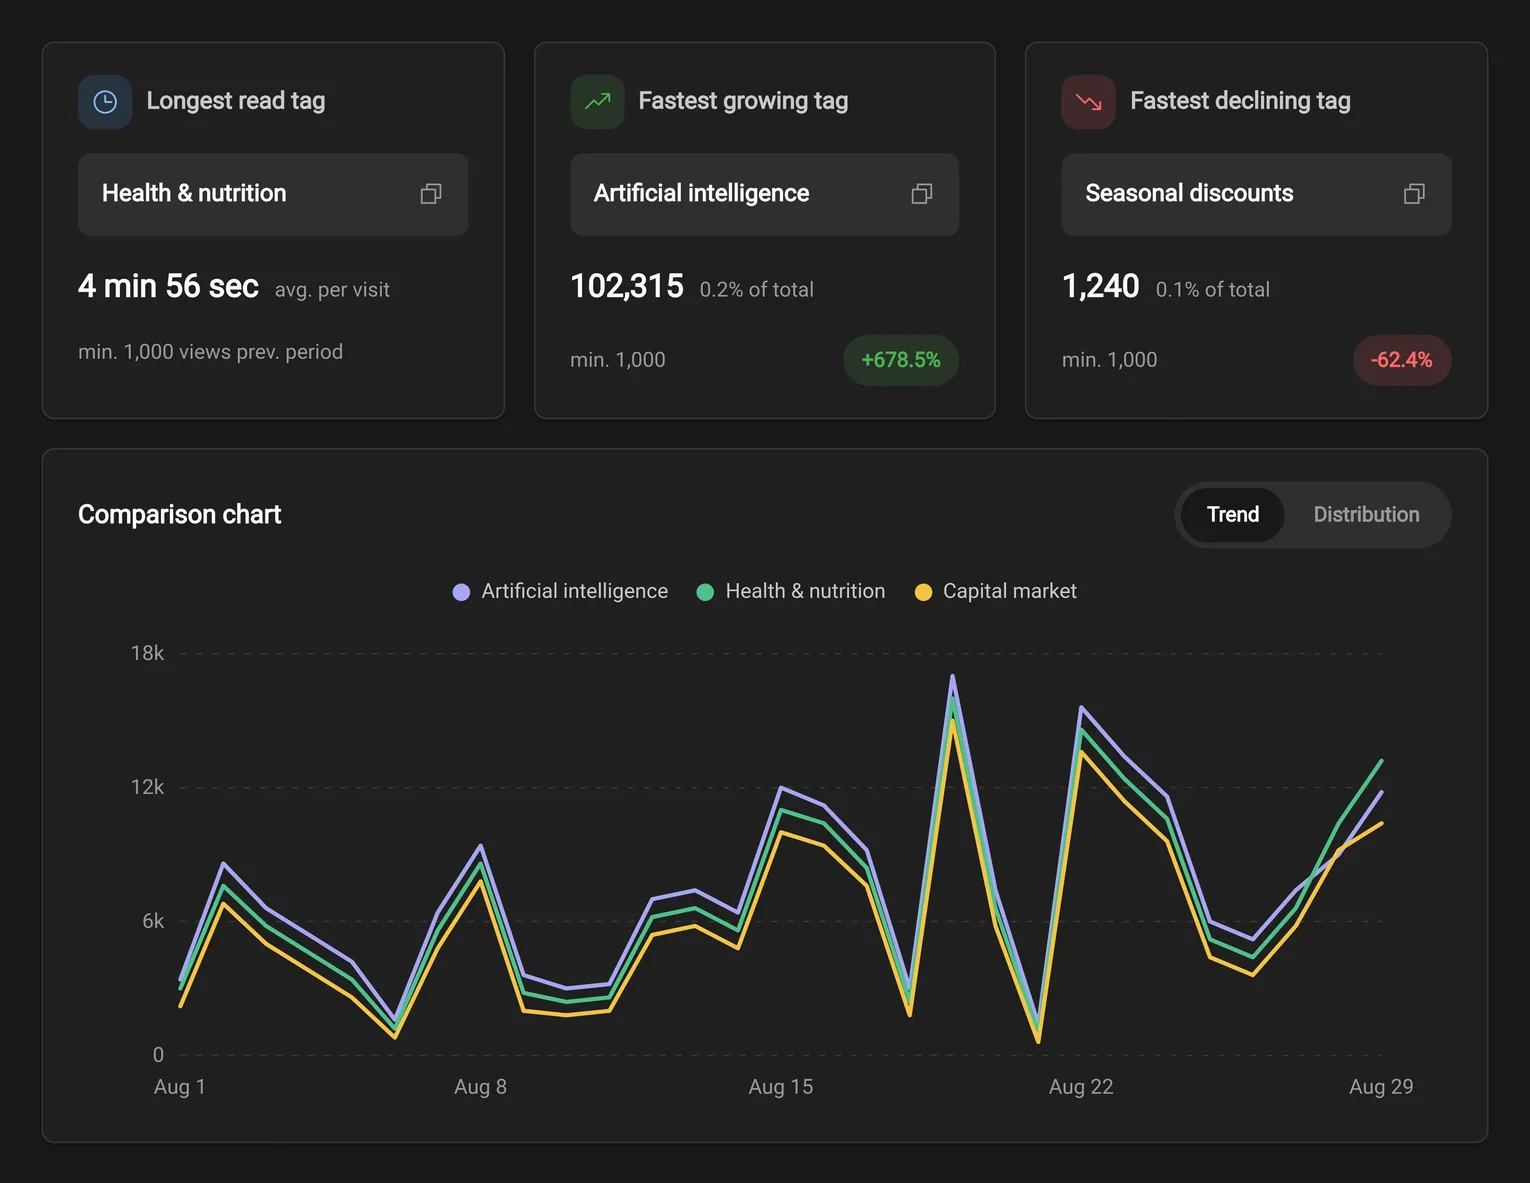
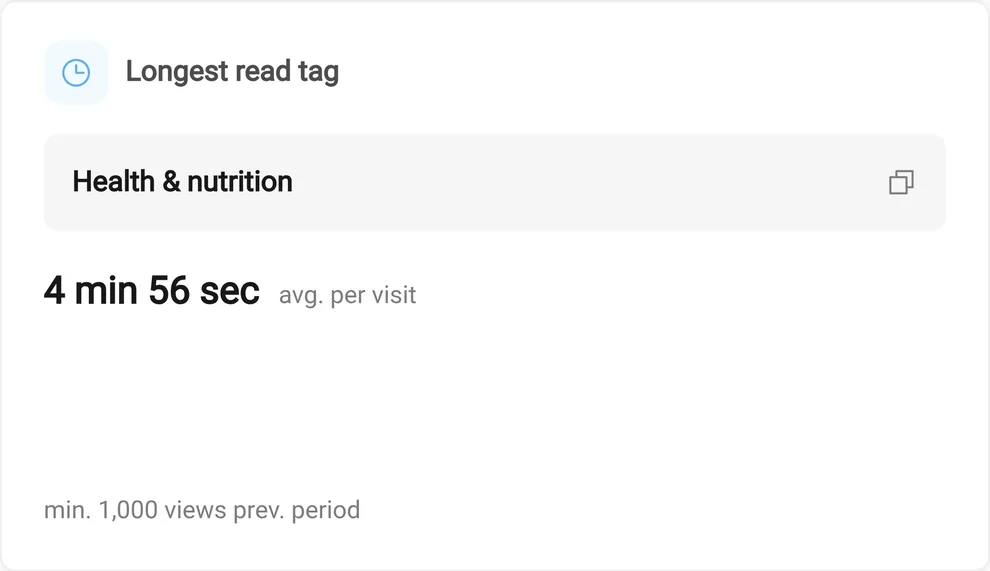
TAGS · ENGAGEMENT
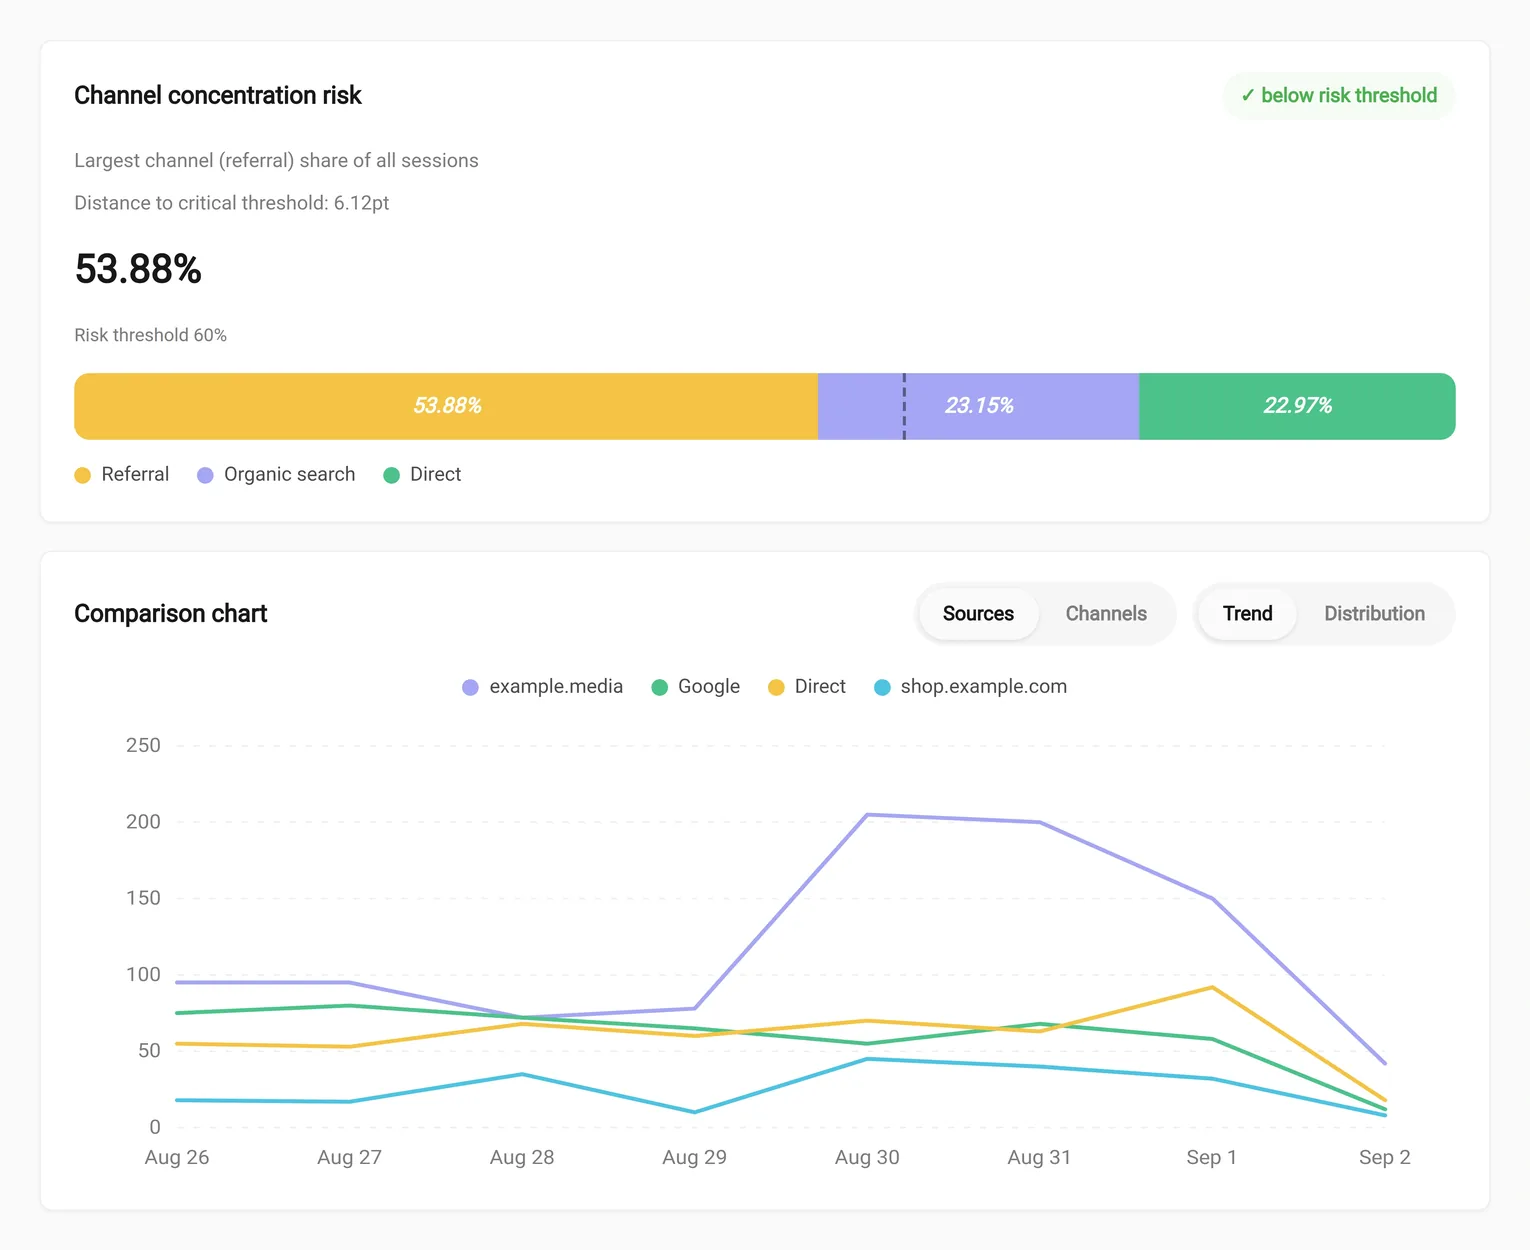
TRAFFIC ACQUISITION · ACQUISITION
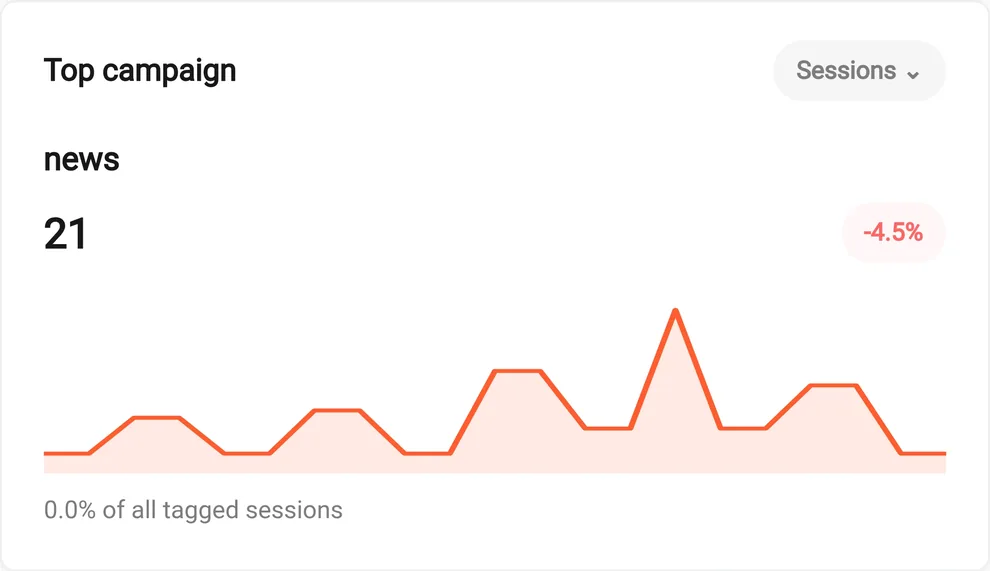
CAMPAIGNS (UTM) · ACQUISITION
Instead of isolated metrics, follow the real sequence of clicks: where users go after each entry page, which paths are busiest, and exactly where they leave the site. The columnar Sankey shows this flow step by step, and the ‘Exit’ node reveals the real drop-off points.
Publishing content, timing campaigns and scheduling maintenance get precise once you know which hours and days your users are most active. The day×hour heatmap shows peaks and troughs at a glance — each cell’s color intensity reflects the activity of that window.
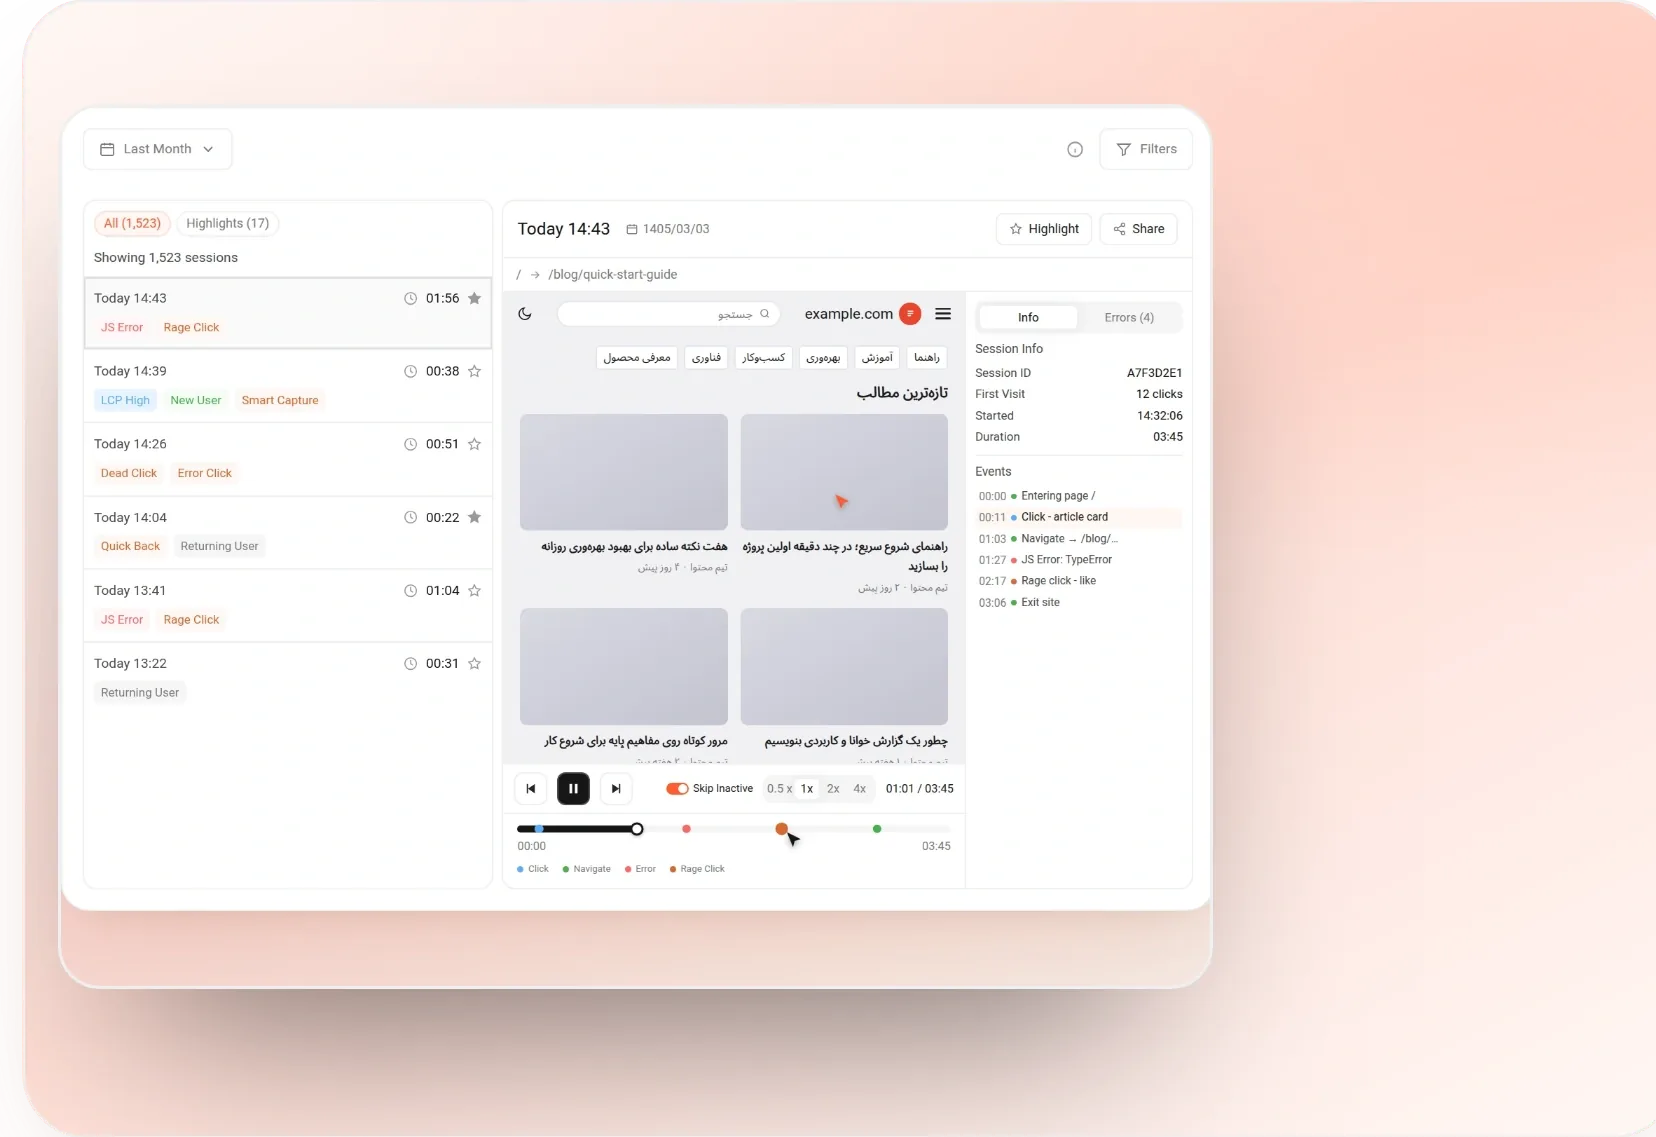
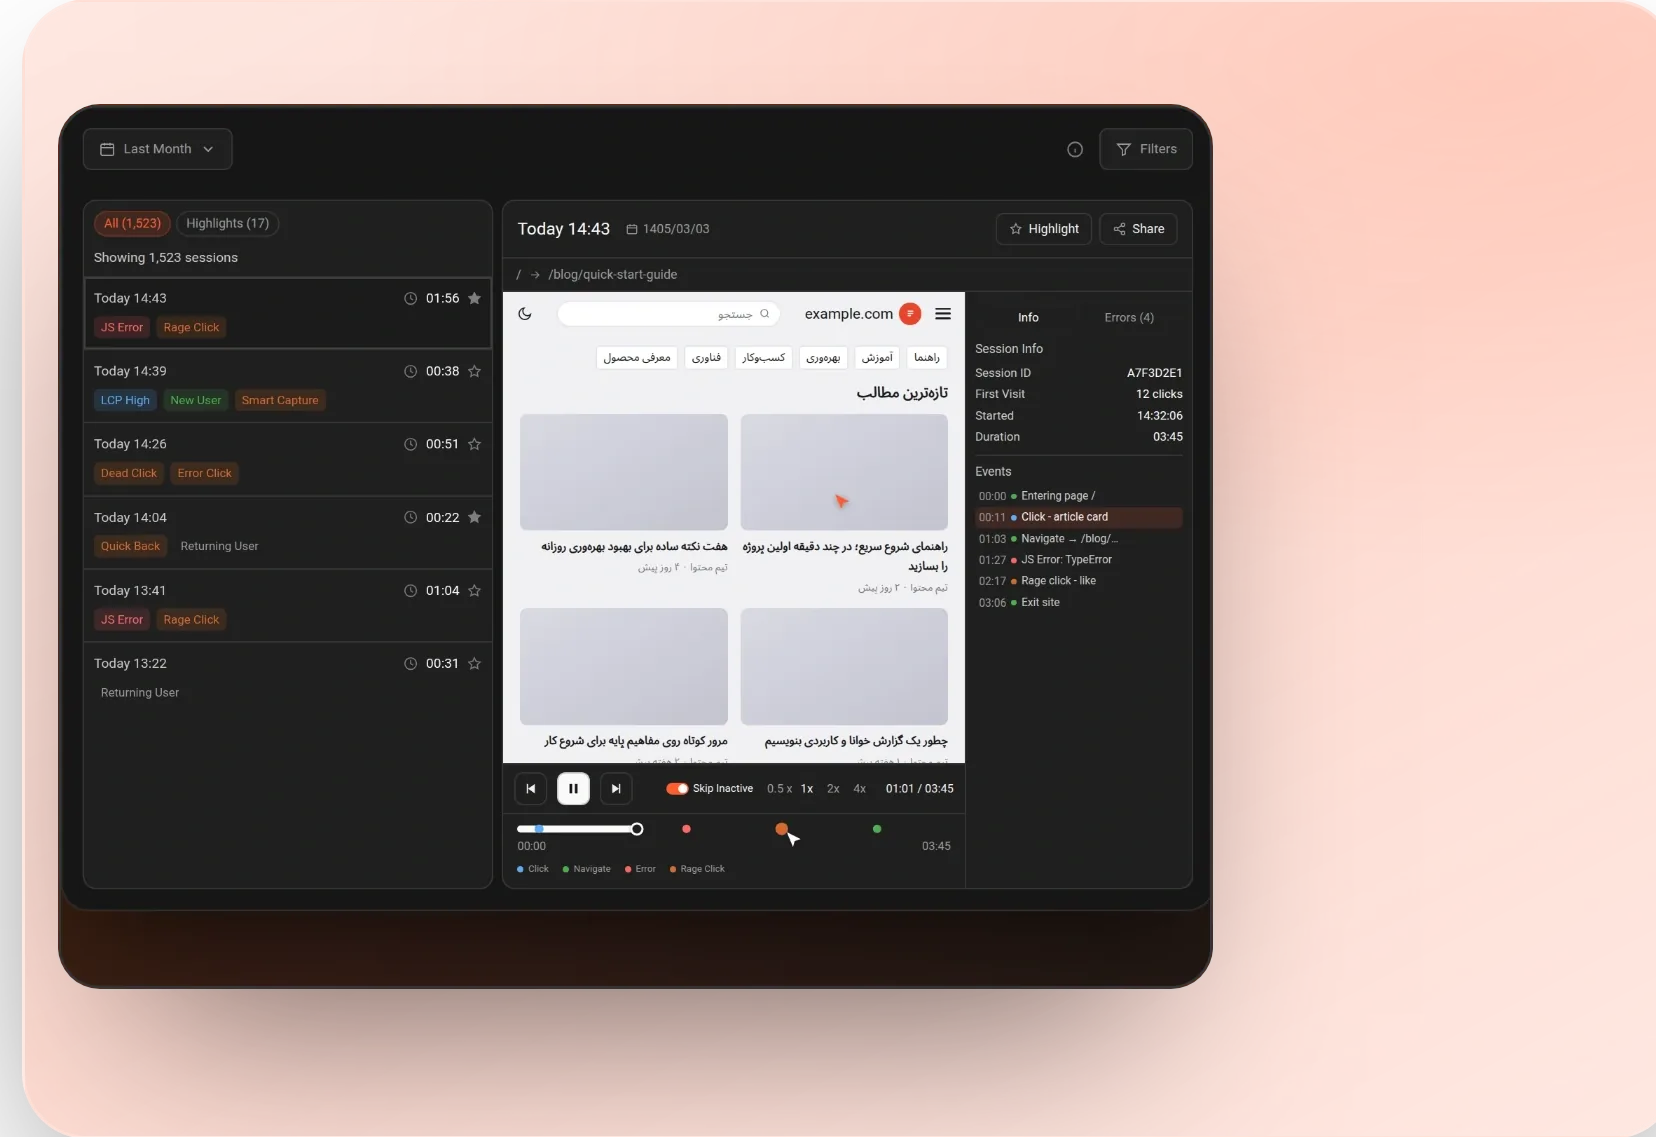
Go beyond the numbers with a precise reconstruction of user behavior — mouse movement, clicks and scrolling. Session Replay shows you exactly where along the journey users hit friction or dropped off.
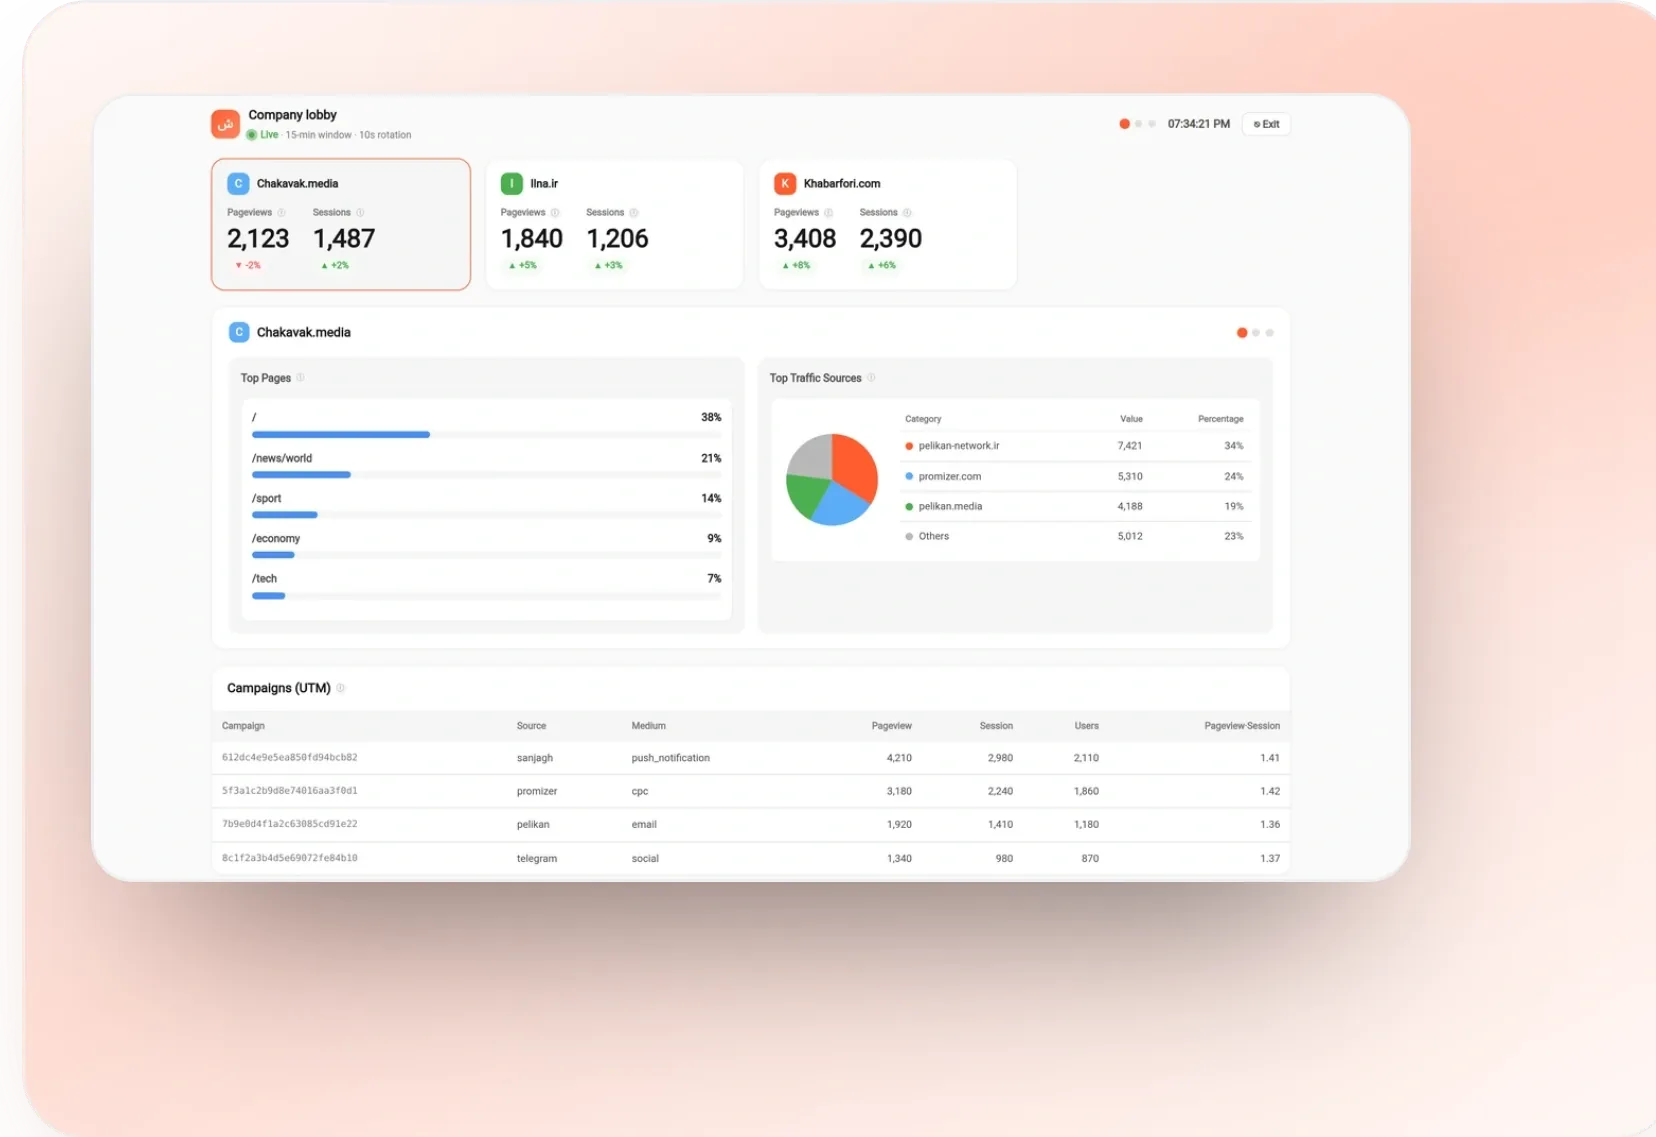
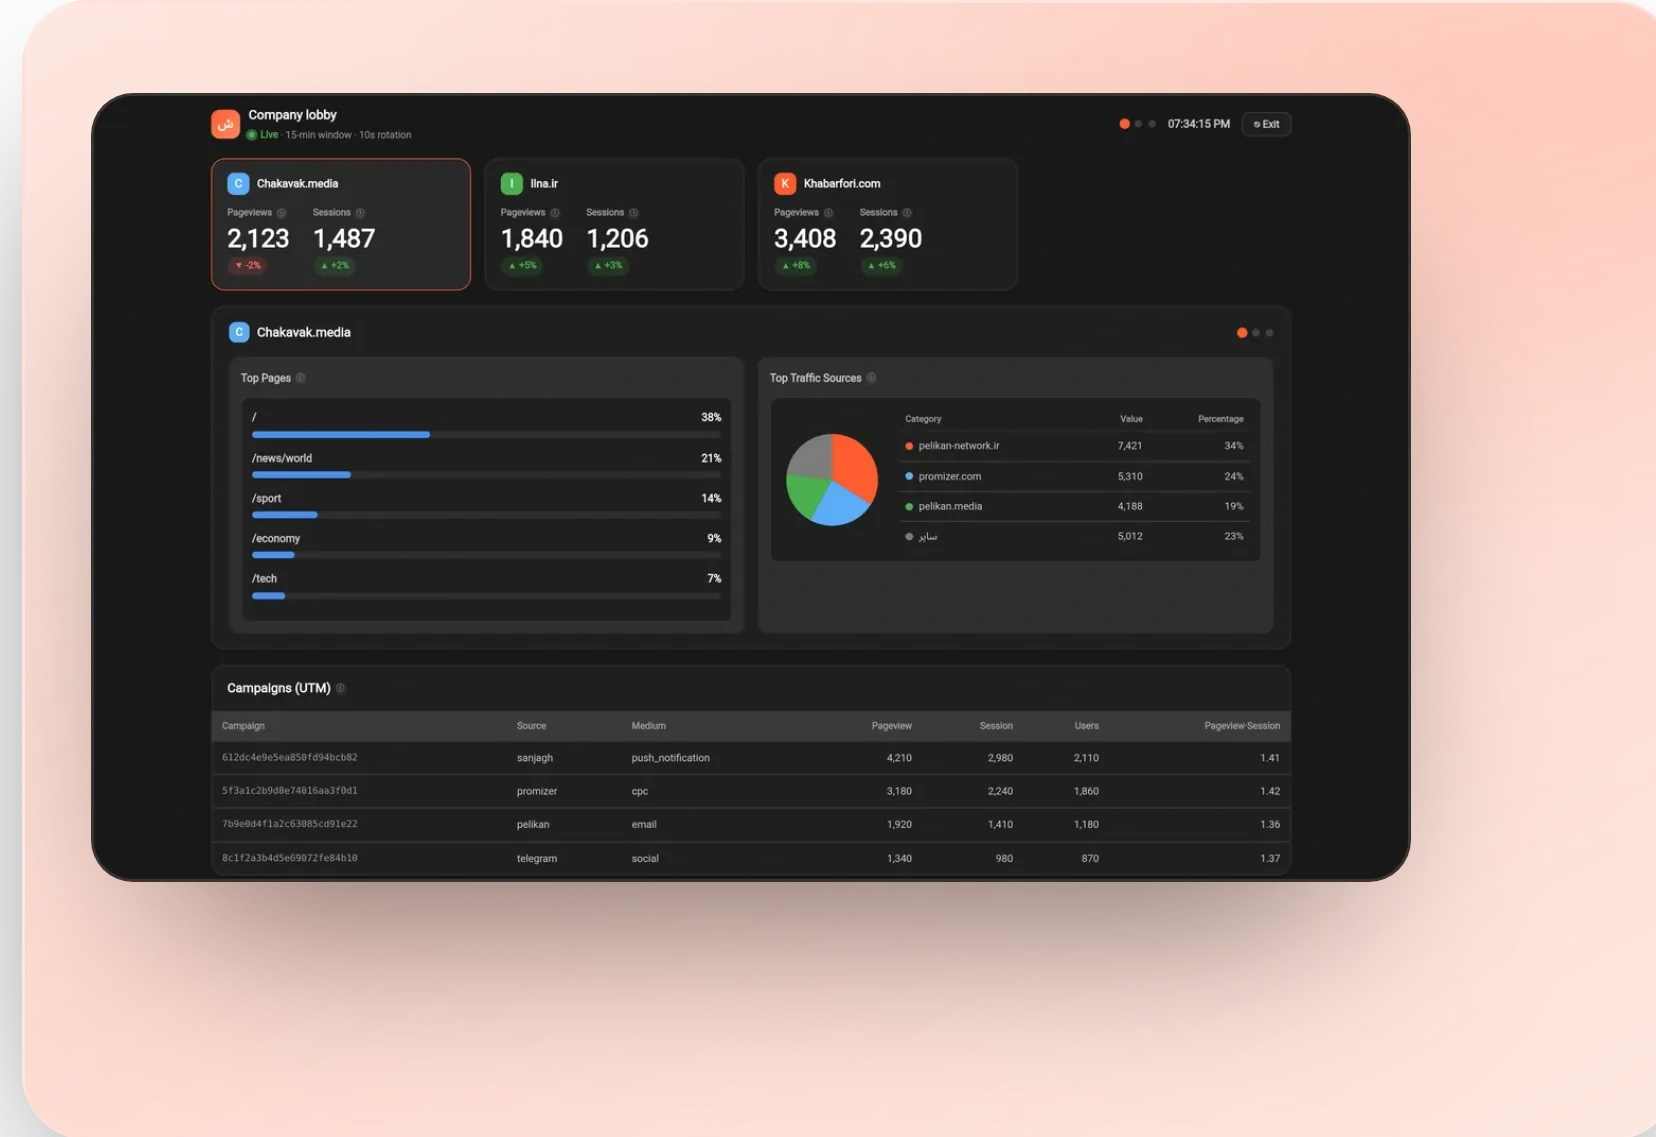
Kiosk Mode brings the Realtime dashboard, in an optimized and simplified layout, to your organization’s public screens — from ops-room monitors and the marketing TV to the company lobby display. Create an independent display profile for each part of the organization so KPIs stay in front of the team at all times.