


Your site's speed isn't one number — it's a chain of stages, each with its own owner
From the moment a user taps a link until the page actually works, redirect, DNS, secure connection, server response and rendering all happen in sequence. Shahin's Performance service pulls those stages apart on your real visits, so instead of guessing you know which link is slow and where to start optimising.
Which key pages pass Google's speed and experience standards?
Go beyond overall averages and assess your site's technical health at the level of each layout. With daily Core Web Vitals monitoring you always know which templates sit at Google's highest quality tier, and you can follow the improvement trend.
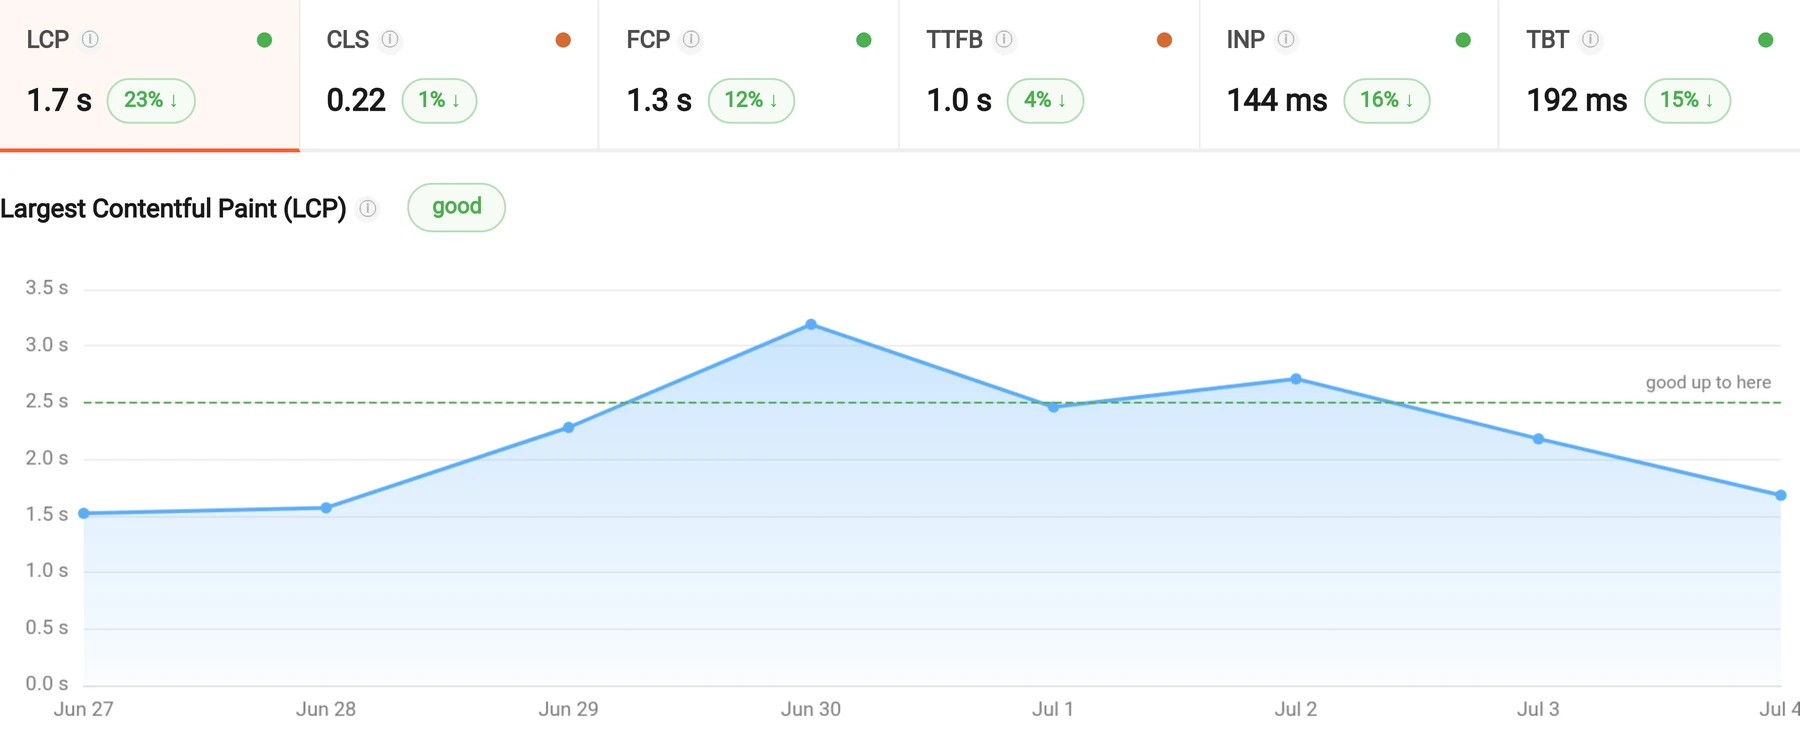 All six metrics improving today vs yesterday · mobileLCP 1.7s — good−23%CLS 0.22 — needs improvement−1%TTFB 1.0s — needs improvement−4%
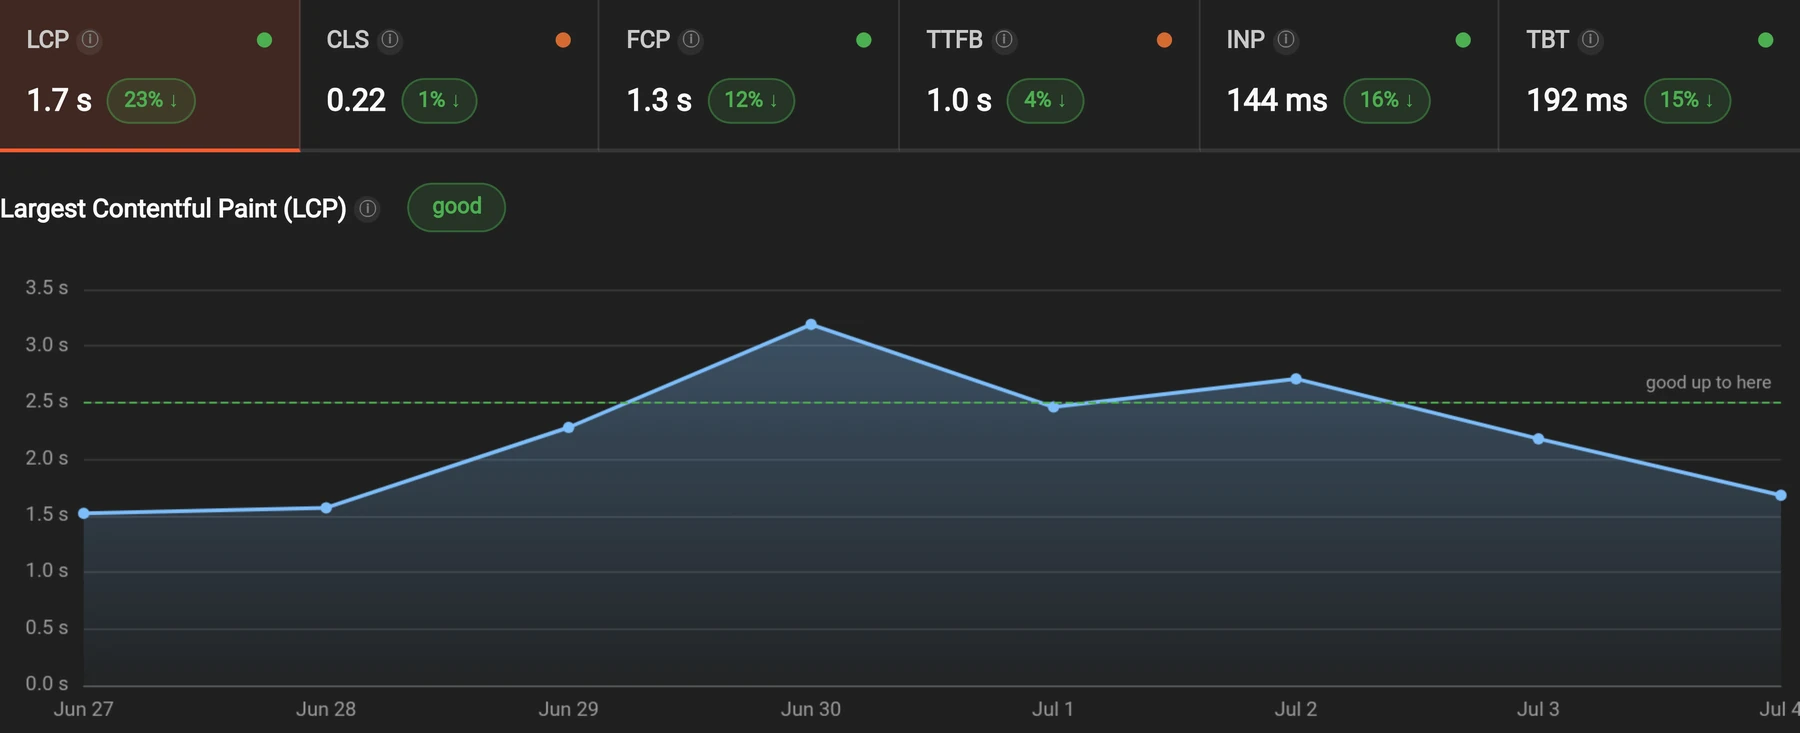
- Six vital metrics on one trend chart: daily checks of LCP, FCP, TTFB, CLS, INP and TBT on every layout, with Google's official threshold lines, so you can be sure the green status holds.
- Mobile and desktop assessed separately: each audience measured on its own, so you can prioritise fixes according to where the bulk of your real traffic actually is.
- Frame-by-frame loading experience (Filmstrip): watch the page render hundredth of a second by hundredth of a second — exactly what the end user experiences as it loads.
- Automatic alerts and a daily report: a health summary of your metrics arrives on Telegram, so the technical team stays aware of quality stability without having to keep checking the panel.
Is the slowness your server, or the user's carrier network?
When a site slows down, finding the cause is rarely simple. It can be DNS, the network connection, the server, or even the user's internet provider. Until you can see those layers separately, finding the bottleneck is mostly guesswork.
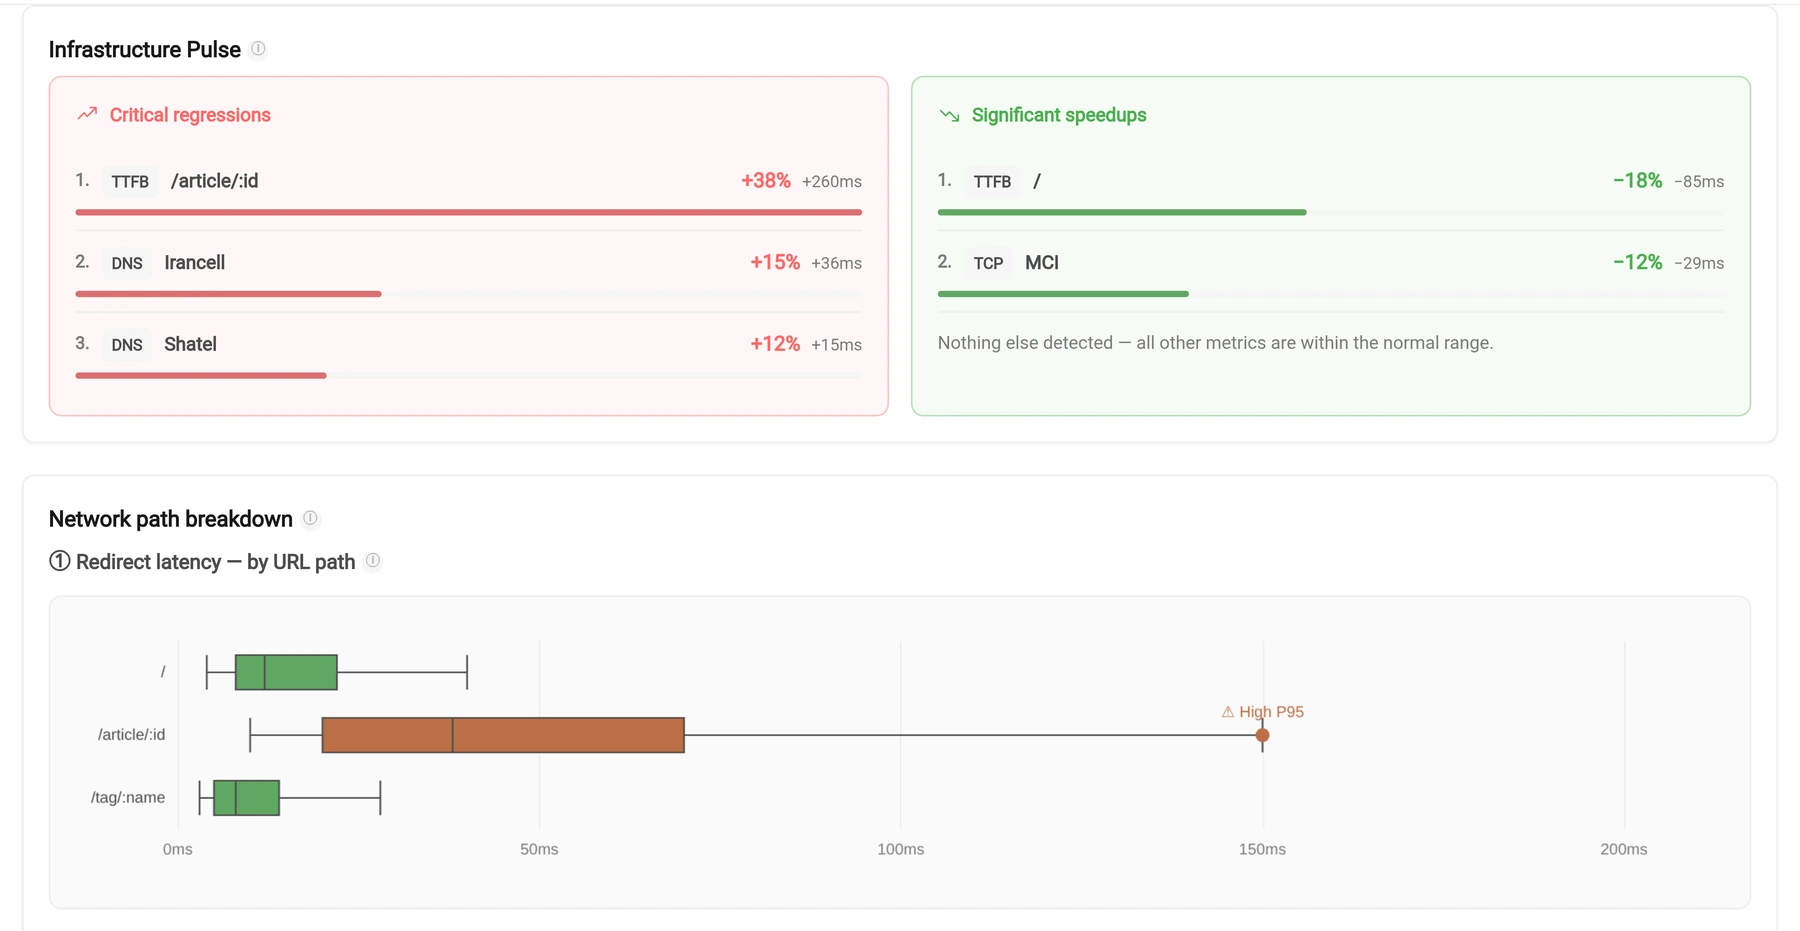 Which path, which carrier? last full day’s P95 vs the 7-day averageServer response · /article/:id+38%DNS resolution · Irancell+15%Server response · home page−18%
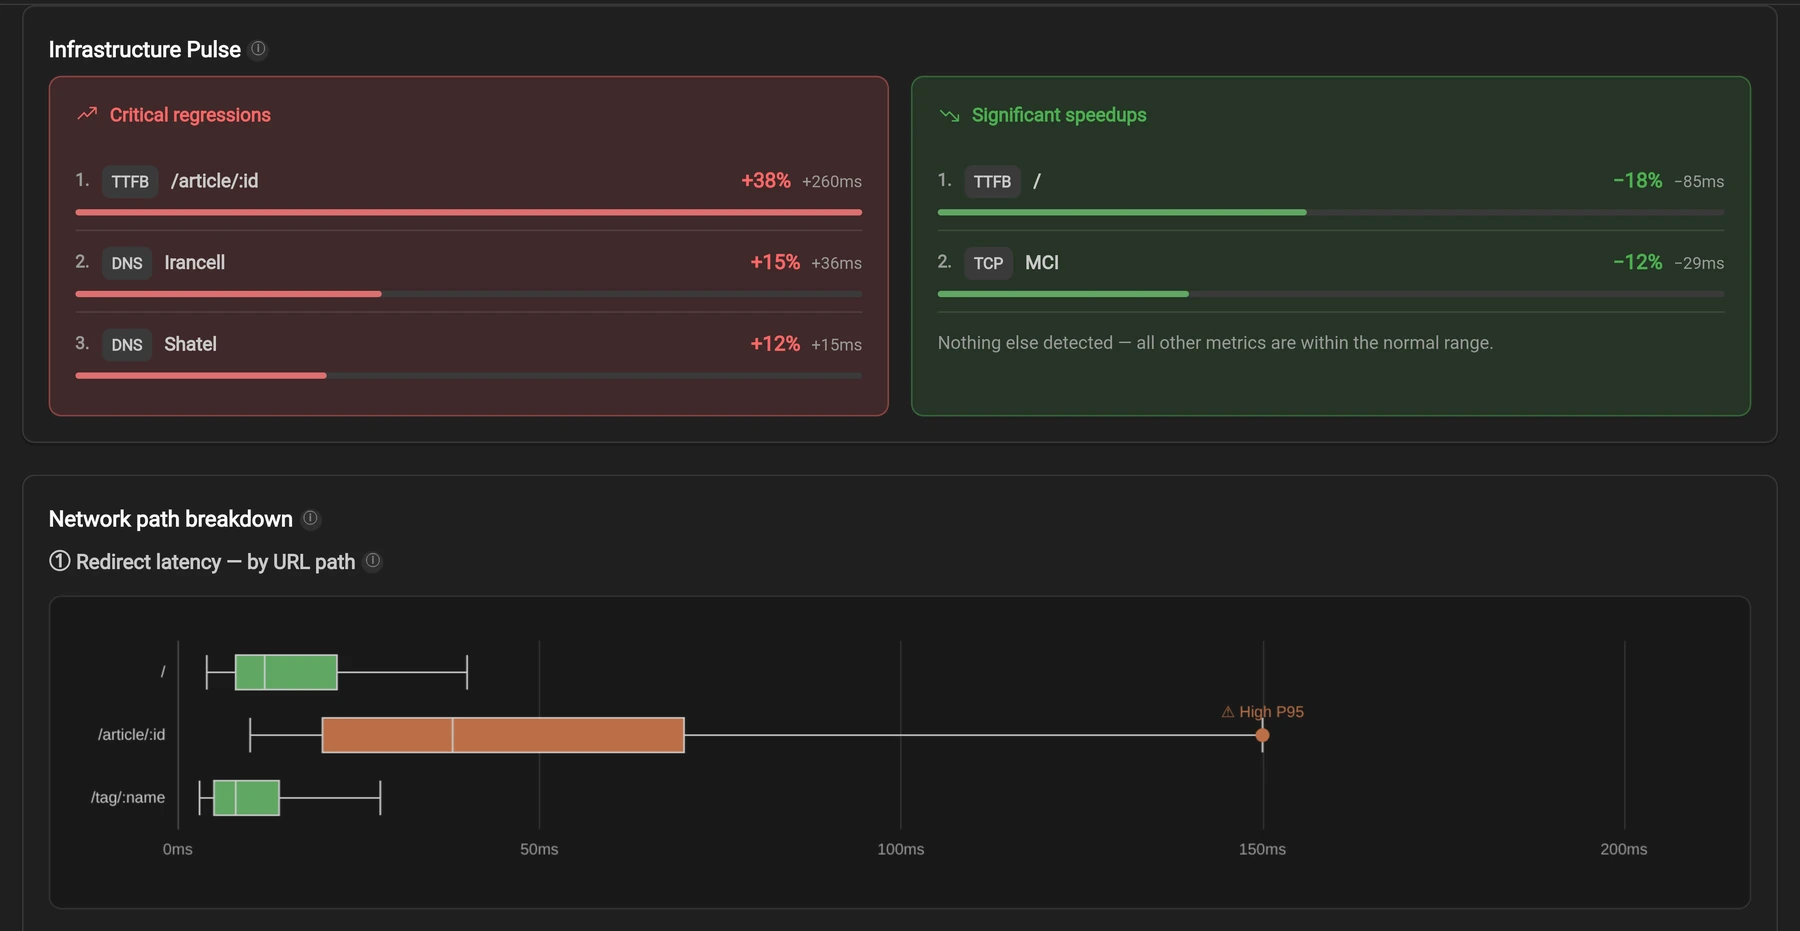
The Infrastructure & Network dashboard in Shahin's Performance service walks the technical path to the first byte layer by layer, so it becomes clear exactly where the slowness starts.
- Layer-by-layer connection breakdown: how much DNS, connection setup and server response each contribute to the total delay.
- Per-carrier analysis: spot the network problems that belong to one carrier, with box plots.
- Smart anomaly detection: critical regressions are logged automatically and the alert goes straight to Telegram.
If you want to make your site faster, you first need to know which layer — and which carrier — the bottleneck sits in.
Explore Infrastructure & NetworkHow quickly does your page become ready for your users?
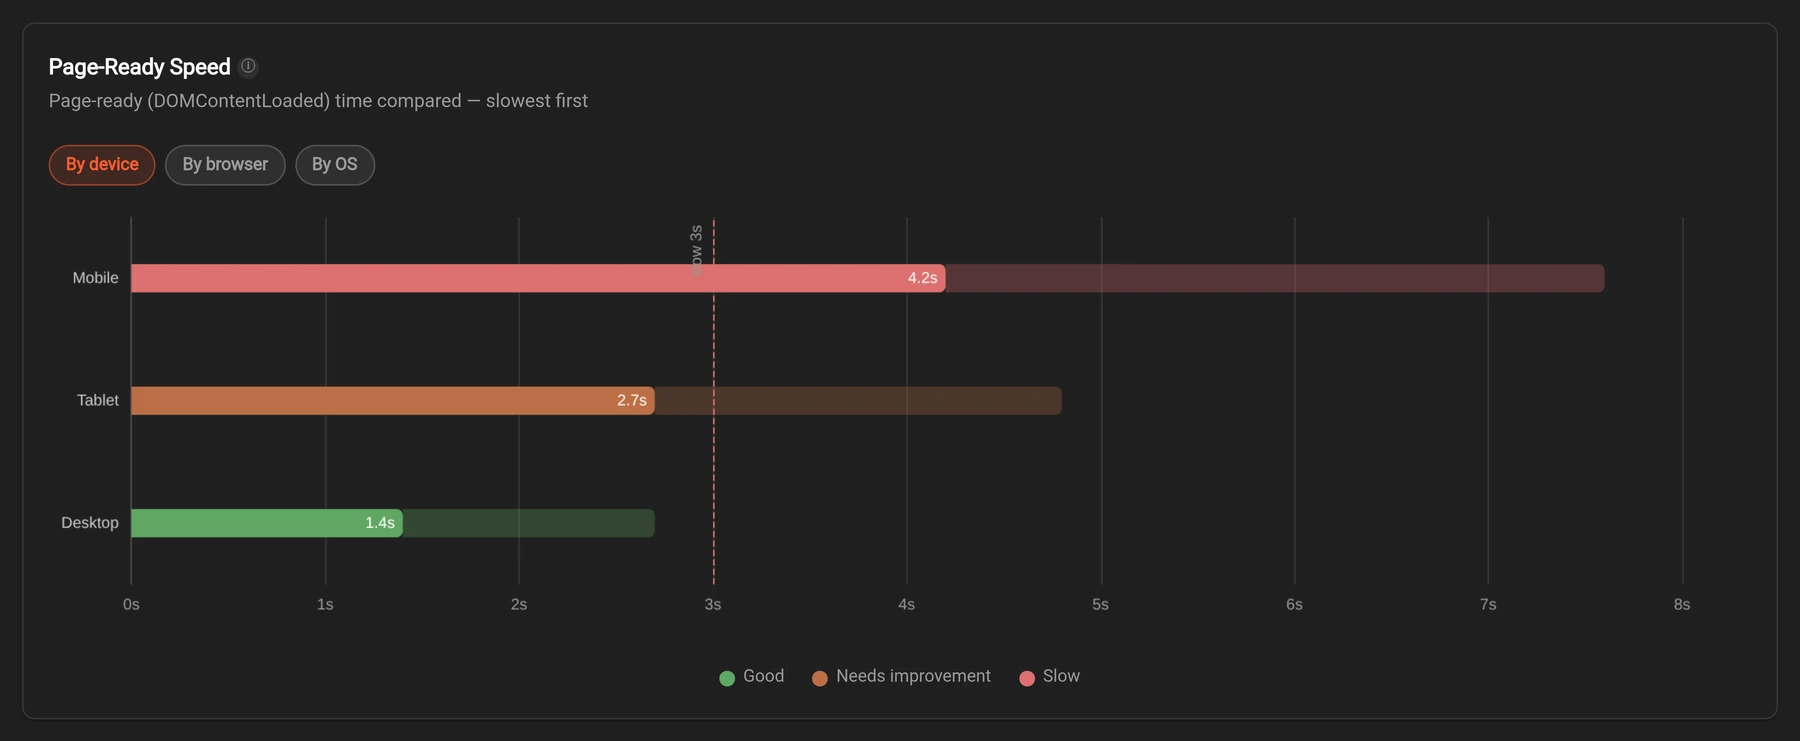
One overall average does not reflect everyone's real experience. The Render & Interaction dashboard measures the interval from the arrival of the first byte until the page structure is fully ready, so it becomes clear exactly which device or browser the slowness happens on.
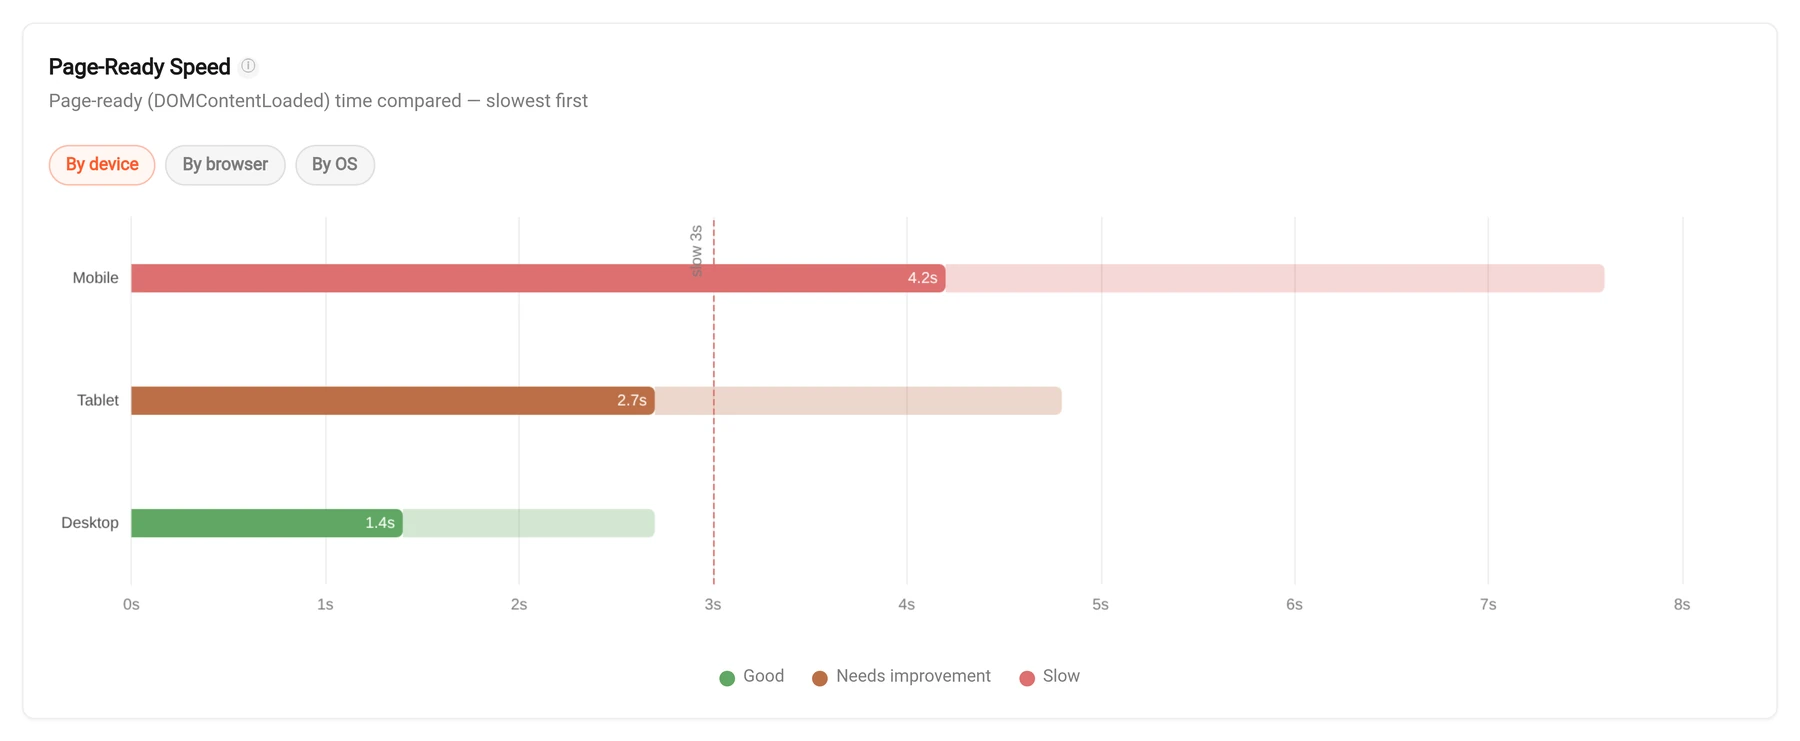 Which device is the slow one? page-ready time; slow past 3sMobile — slow4.2sTablet — needs improvement2.7sDesktop — good1.4s
- Three key metrics: browser processing time, page structure ready time (DOMContentLoaded), and the slow-experience rate.
- A comparison of how fast pages become ready, from the slowest to the fastest.
- The same data across three different dimensions: device, browser and operating system.
- Automatic render-anomaly detection comparing the last 24 hours with the previous week, in two groups: regressions and improvements.
- Identification of the slowest areas so you know exactly where to start optimising.
If you want to cut your exit rate and build a better experience, you have to see your site's speed through your user's eyes — not through one overall average.
Explore Render & Interaction